Allowing and controlling traffic coming into a cluster from the outside (north-south) is needed in most use cases. In general, ingress controllers are responsible for this in the Kubernetes world. There are a bunch of these available (a good comparison can be found here), but if you’re using Istio it makes sense to use its own ingress gateway.
Backyards 1.3 provides gateway management and observability, allowing you to:
- list all Istio gateways in the cluster,
- monitor the gateways out-of-the-box,
- configure ports, hosts, certificates and
- configure routes and other traffic management features of the incoming traffic.
Essentially, Backyards provides a lightweight API gateway management UI, built purely on Istio primitives.
Note: Convenience features like JWT authentication or rate limiting are currently not supported, but it is fully customizable by using Envoy WASM extensions.
The MENU > GATEWAYS page of the Backyards web interface allows you to:
- View the configuration of every gateway.
- Monitor the upstream traffic.
- Manage the port and host configurations.
- Manage routing and traffic.
- Configure TLS settings on the gateway, including cert-manager and Let’s Encrypt setup.
Note: the open source Banzai Cloud Istio operator has a concept called
MeshGateway, a declarative representation of Istio ingress and egress gateway services and deployments. With the help ofMeshGateways, it’s easy to set up multiple gateways in a cluster, and use them for different purposes.
List gateways 🔗︎
To list the gateways of your service mesh, navigate to MENU > GATEWAYS.

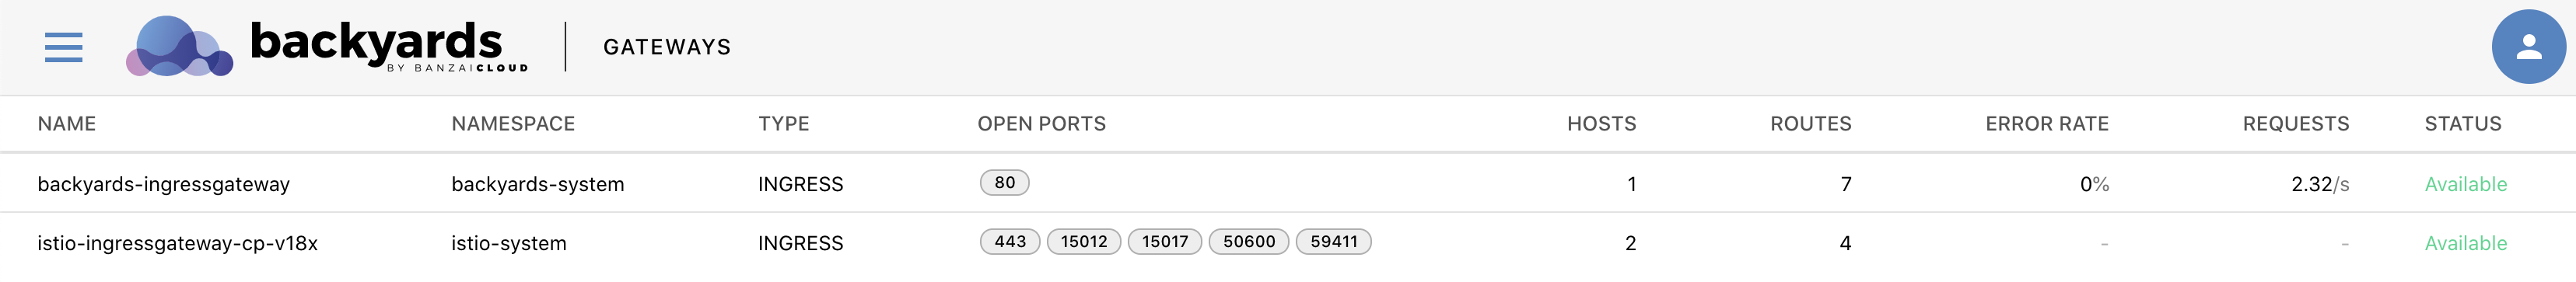
For each gateway, the following information is shown:
- Name: The name of the gateway.
- Namespace: The namespace the gateway belongs to.
- Type: Type of the gateway.
- Open ports: The ports the gateway accepts connections on.
- Hosts: Number of hosts accessible using the gateway.
- Routes: Number of routing rules configured for the ingress traffic.
- Error rate: The number of errors during the last polling interval.
- Requests per second: The number of requests per second during the last polling interval.
- Status: Status of the gateway.
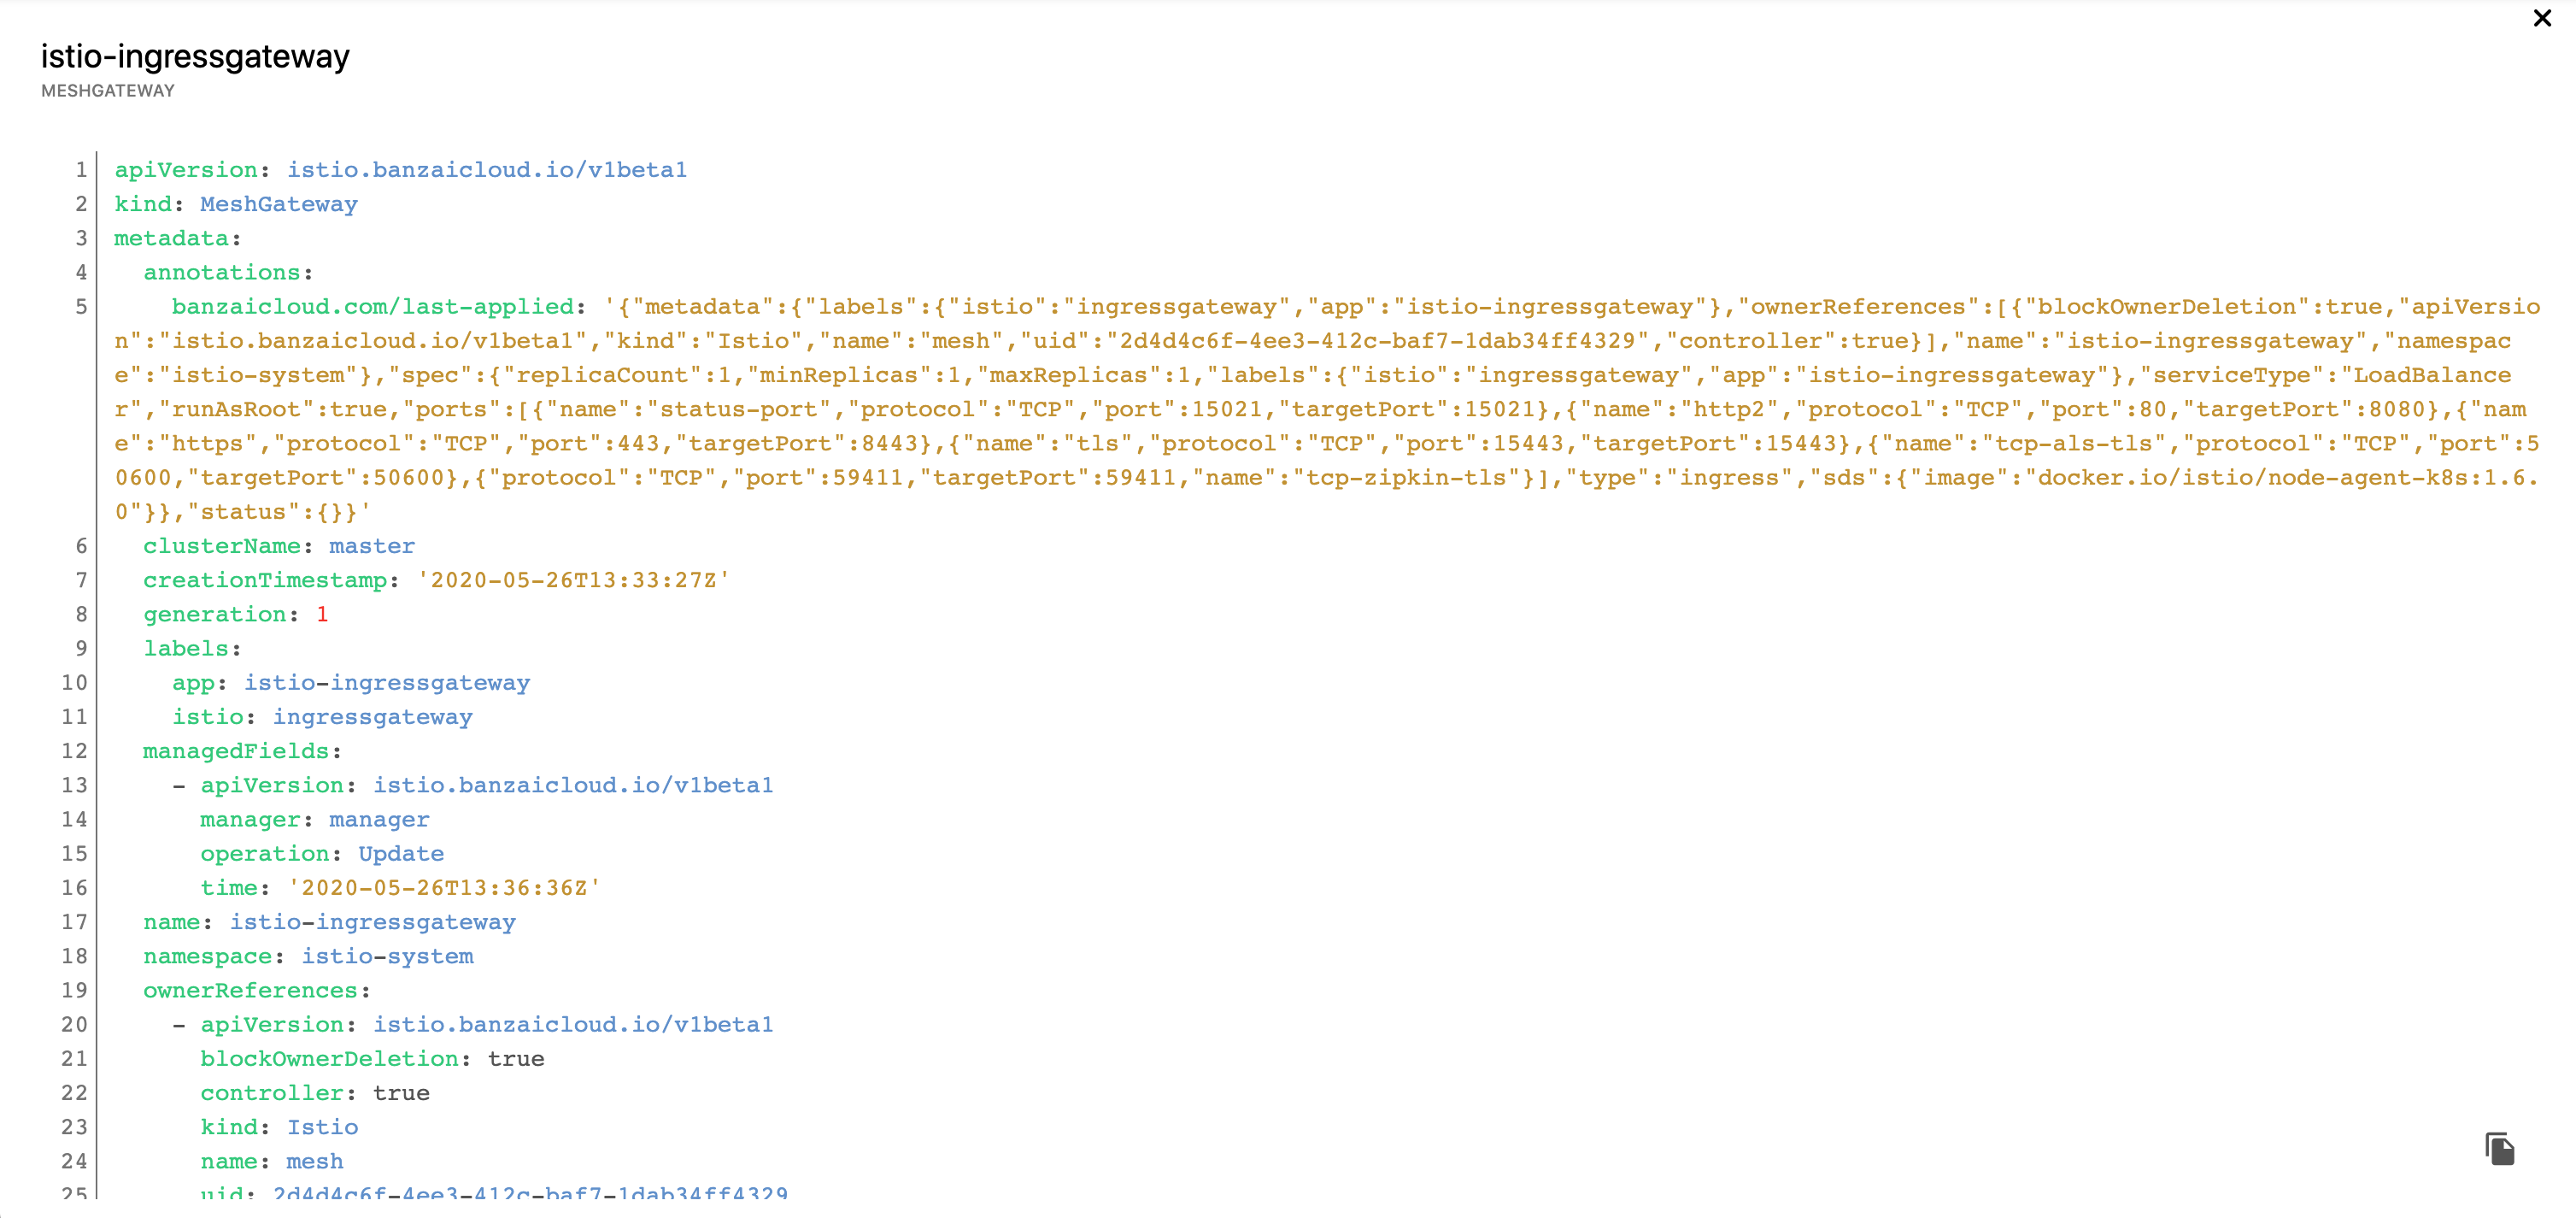
Click the name of a gateway to display the details of the gateway (grouped into several tabs, for example, Overview and host configuration, Routes, Deployment and Service).
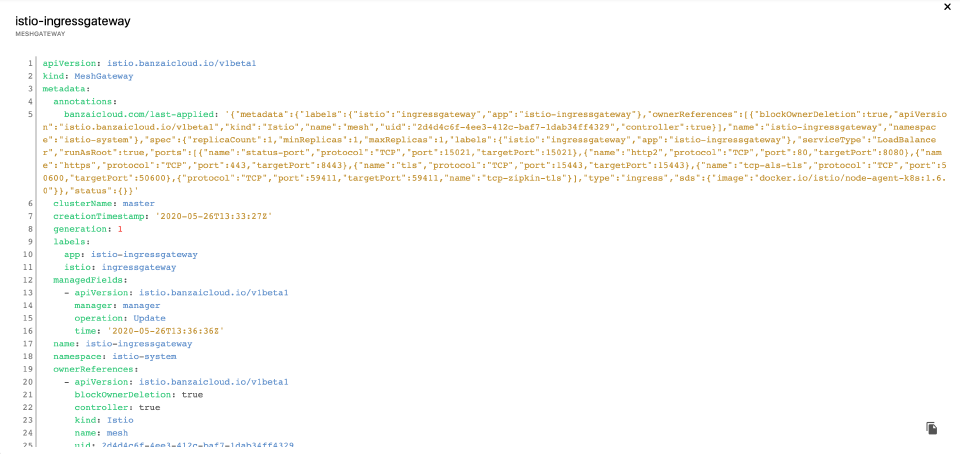
To display the YAML configuration of MeshGateways, Gateways, or VirtualServices, click the name of the gateway in the list, then click the ![]() icon next to their name.
icon next to their name.
![]()

Monitor upstream traffic 🔗︎
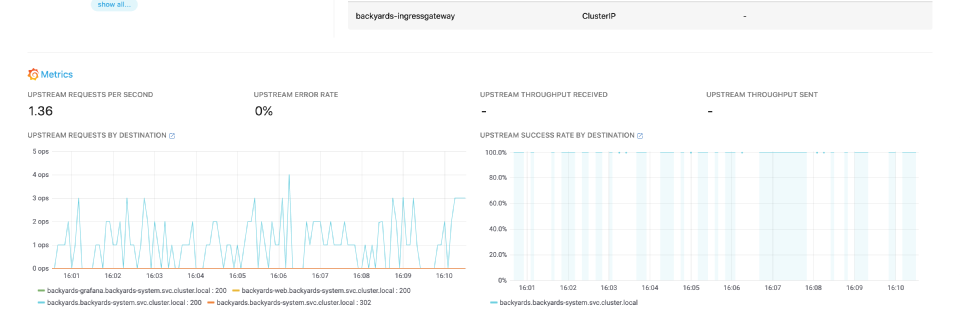
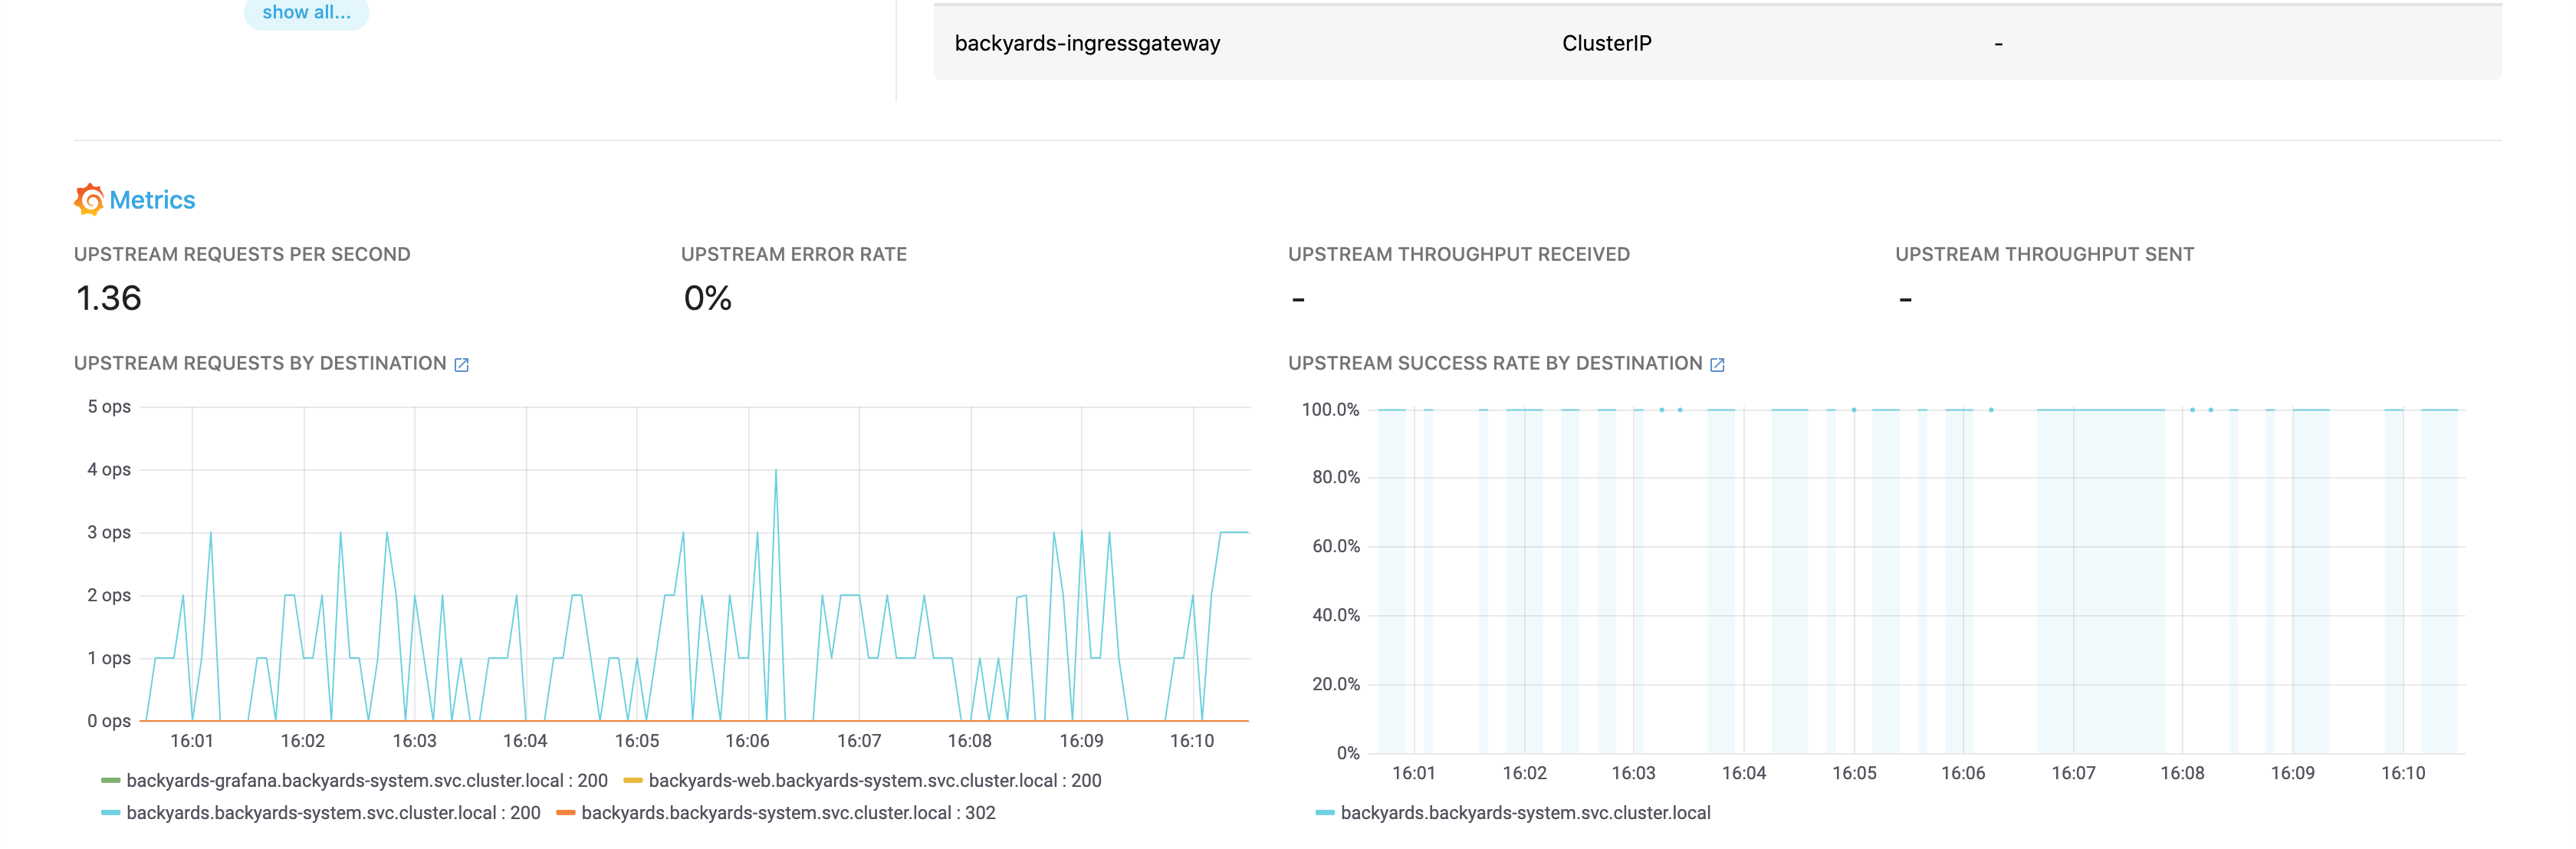
Backyards collects upstream metrics like latencies, throughput, RPS, or error rate from Prometheus, and provides a summary for each gateway. It also sets up a Grafana dashboard and displays appropriate charts in-place.
To monitor the upstream traffic of your Istio gateways, complete the following steps.
-
Open the Backyards web interface, and navigate to MENU > GATEWAYS.
-
From the list of gateways, click the gateway you want to monitor.
-
On the OVERVIEW tab, scroll down to the METRICS section. The most important metrics of the gateway are displayed on the Backyards web interface (for example, upstream requests per second and error rate).
Note: You can also view the details of the service or the deployment related to the gateway.
Click
 to open the related dashboards in Grafana.
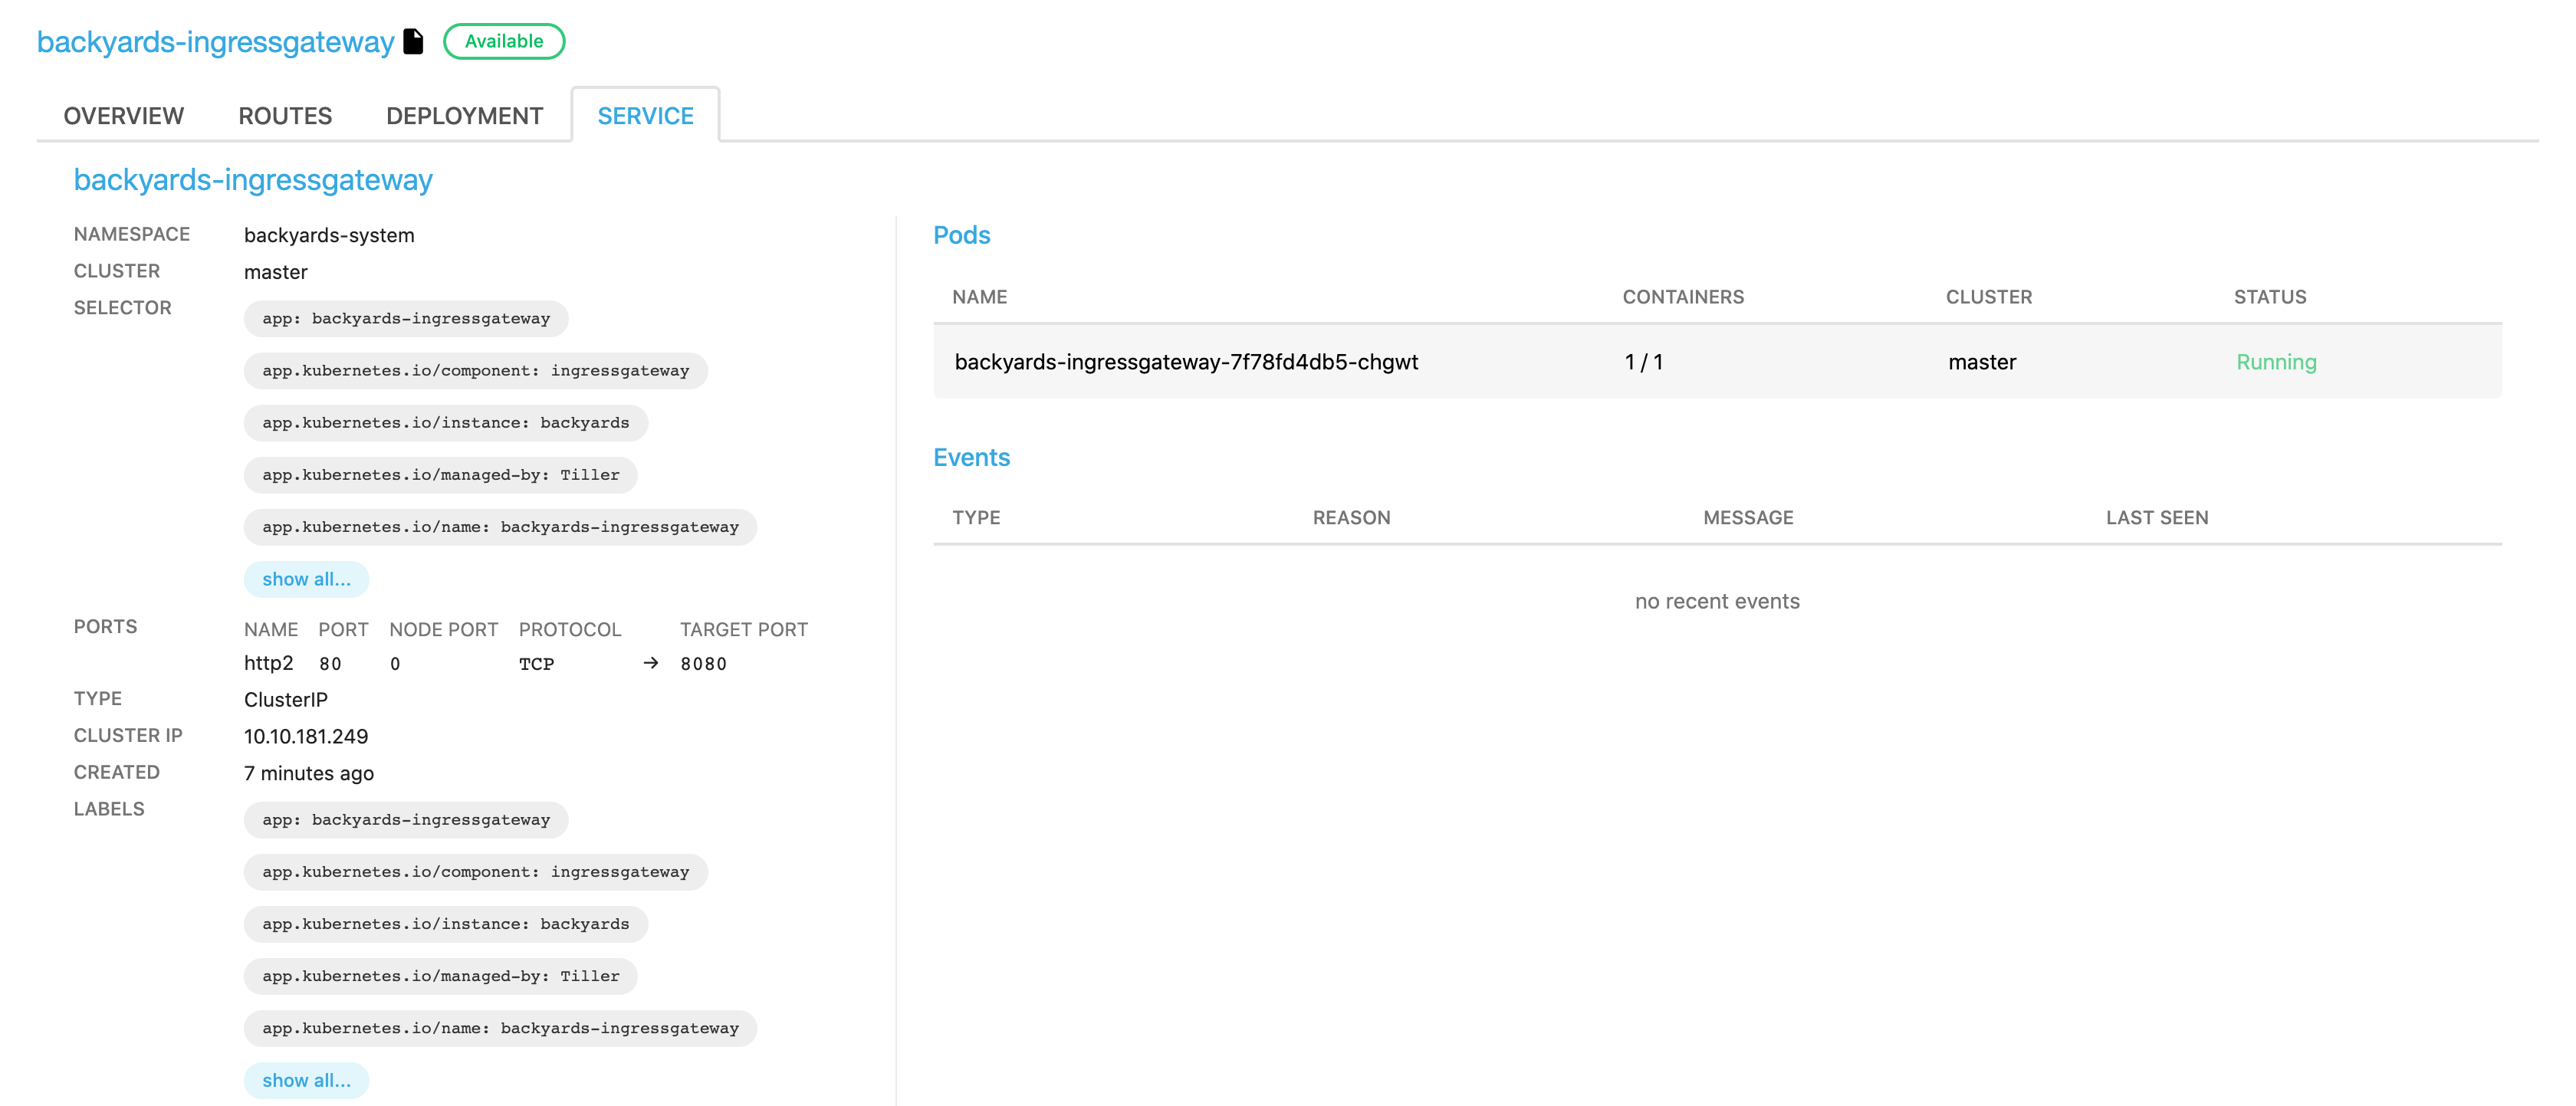
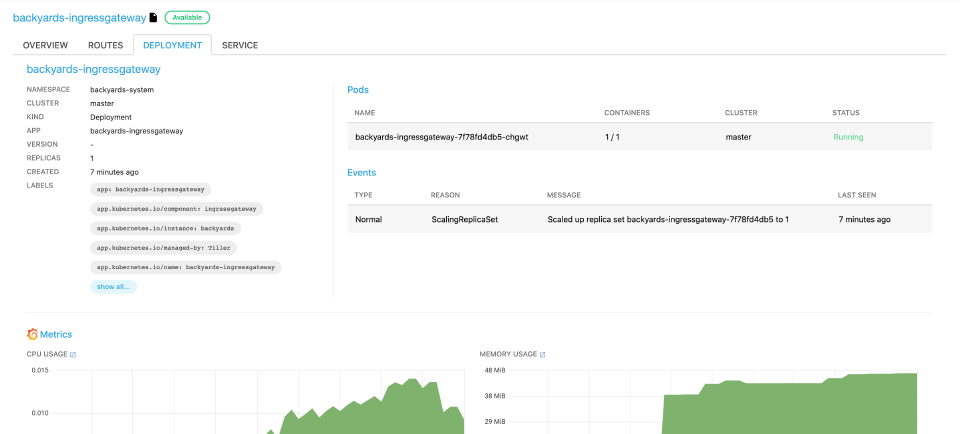
Gateway deployment and service details 🔗︎
To display the details, events, and most important metrics of the deployment and service related to a gateway, navigate to MENU > GATEWAYS > <Gateway-to-inspect>, then click SERVICE or DEPLOYMENT.