The traffic tap feature of Backyards enables you to monitor live access logs of the Istio sidecar proxies. Each sidecar proxy outputs access information for the individual HTTP requests or HTTP/gRPC streams.
The access logs contain information about the:
- reporter proxy,
- source and destination workloads,
- request,
- response, as well as the
- timings.
Try it out! 🔗︎
Using the Backyards CLI 🔗︎
These examples work out of the box with the demo application packaged with Backyards. Change the service name and namespace to match your service.
To watch the access logs for an individual namespace, workload or pod, use the tap command:
# Usage:
#  backyards tap [[ns|workload|pod]/resource-name] [flags]

# tap the backyards-demo namespace
backyards tap ns/backyards-demo

# tap the bookings-v1 workload in the backyards-demo namespace
backyards tap --ns backyards-demo workload/bookings-v1

# tap a pod of the bookings app in the backyards-demo namespace
POD_NAME=$(kubectl get pod -n backyards-demo -l app=bookings -o jsonpath="{.items[0]..metadata.name}")
backyards tap --ns backyards-demo pod/$POD_NAME
At this volume it’s difficult to find the relevant or problematic log lines. You can use filter flags to narrow them down:
# server errors
backyards tap ns/backyards-demo --method GET --response-code 500,599
By changing the output format to JSON, you will be able to use the command line tool jq to further filter or map the log entries:
# get pods with a specific user-agent
backyards tap ns/backyards-demo -o json | jq 'select(.request.userAgent=="grpc-go/1.17.0,fasthttp") | .source.name'
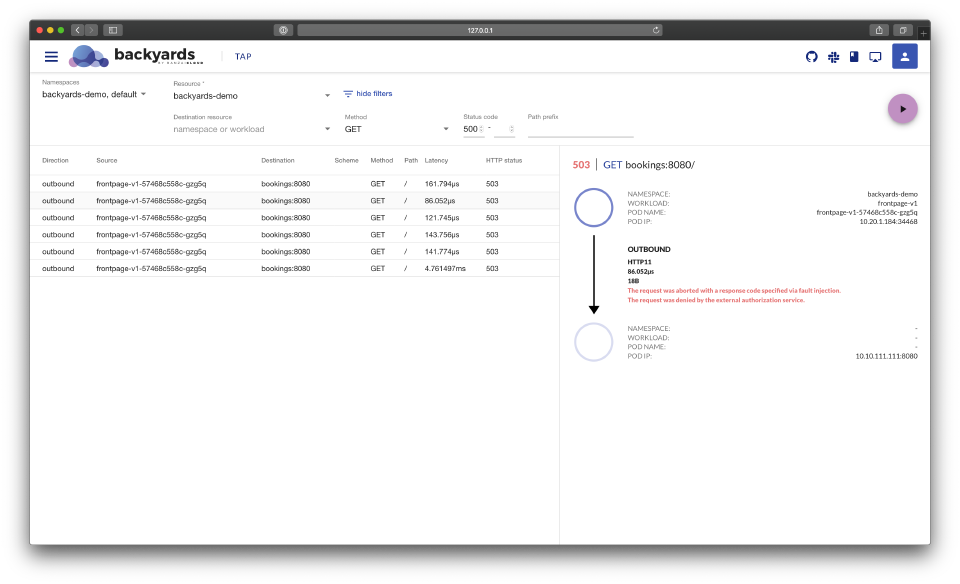
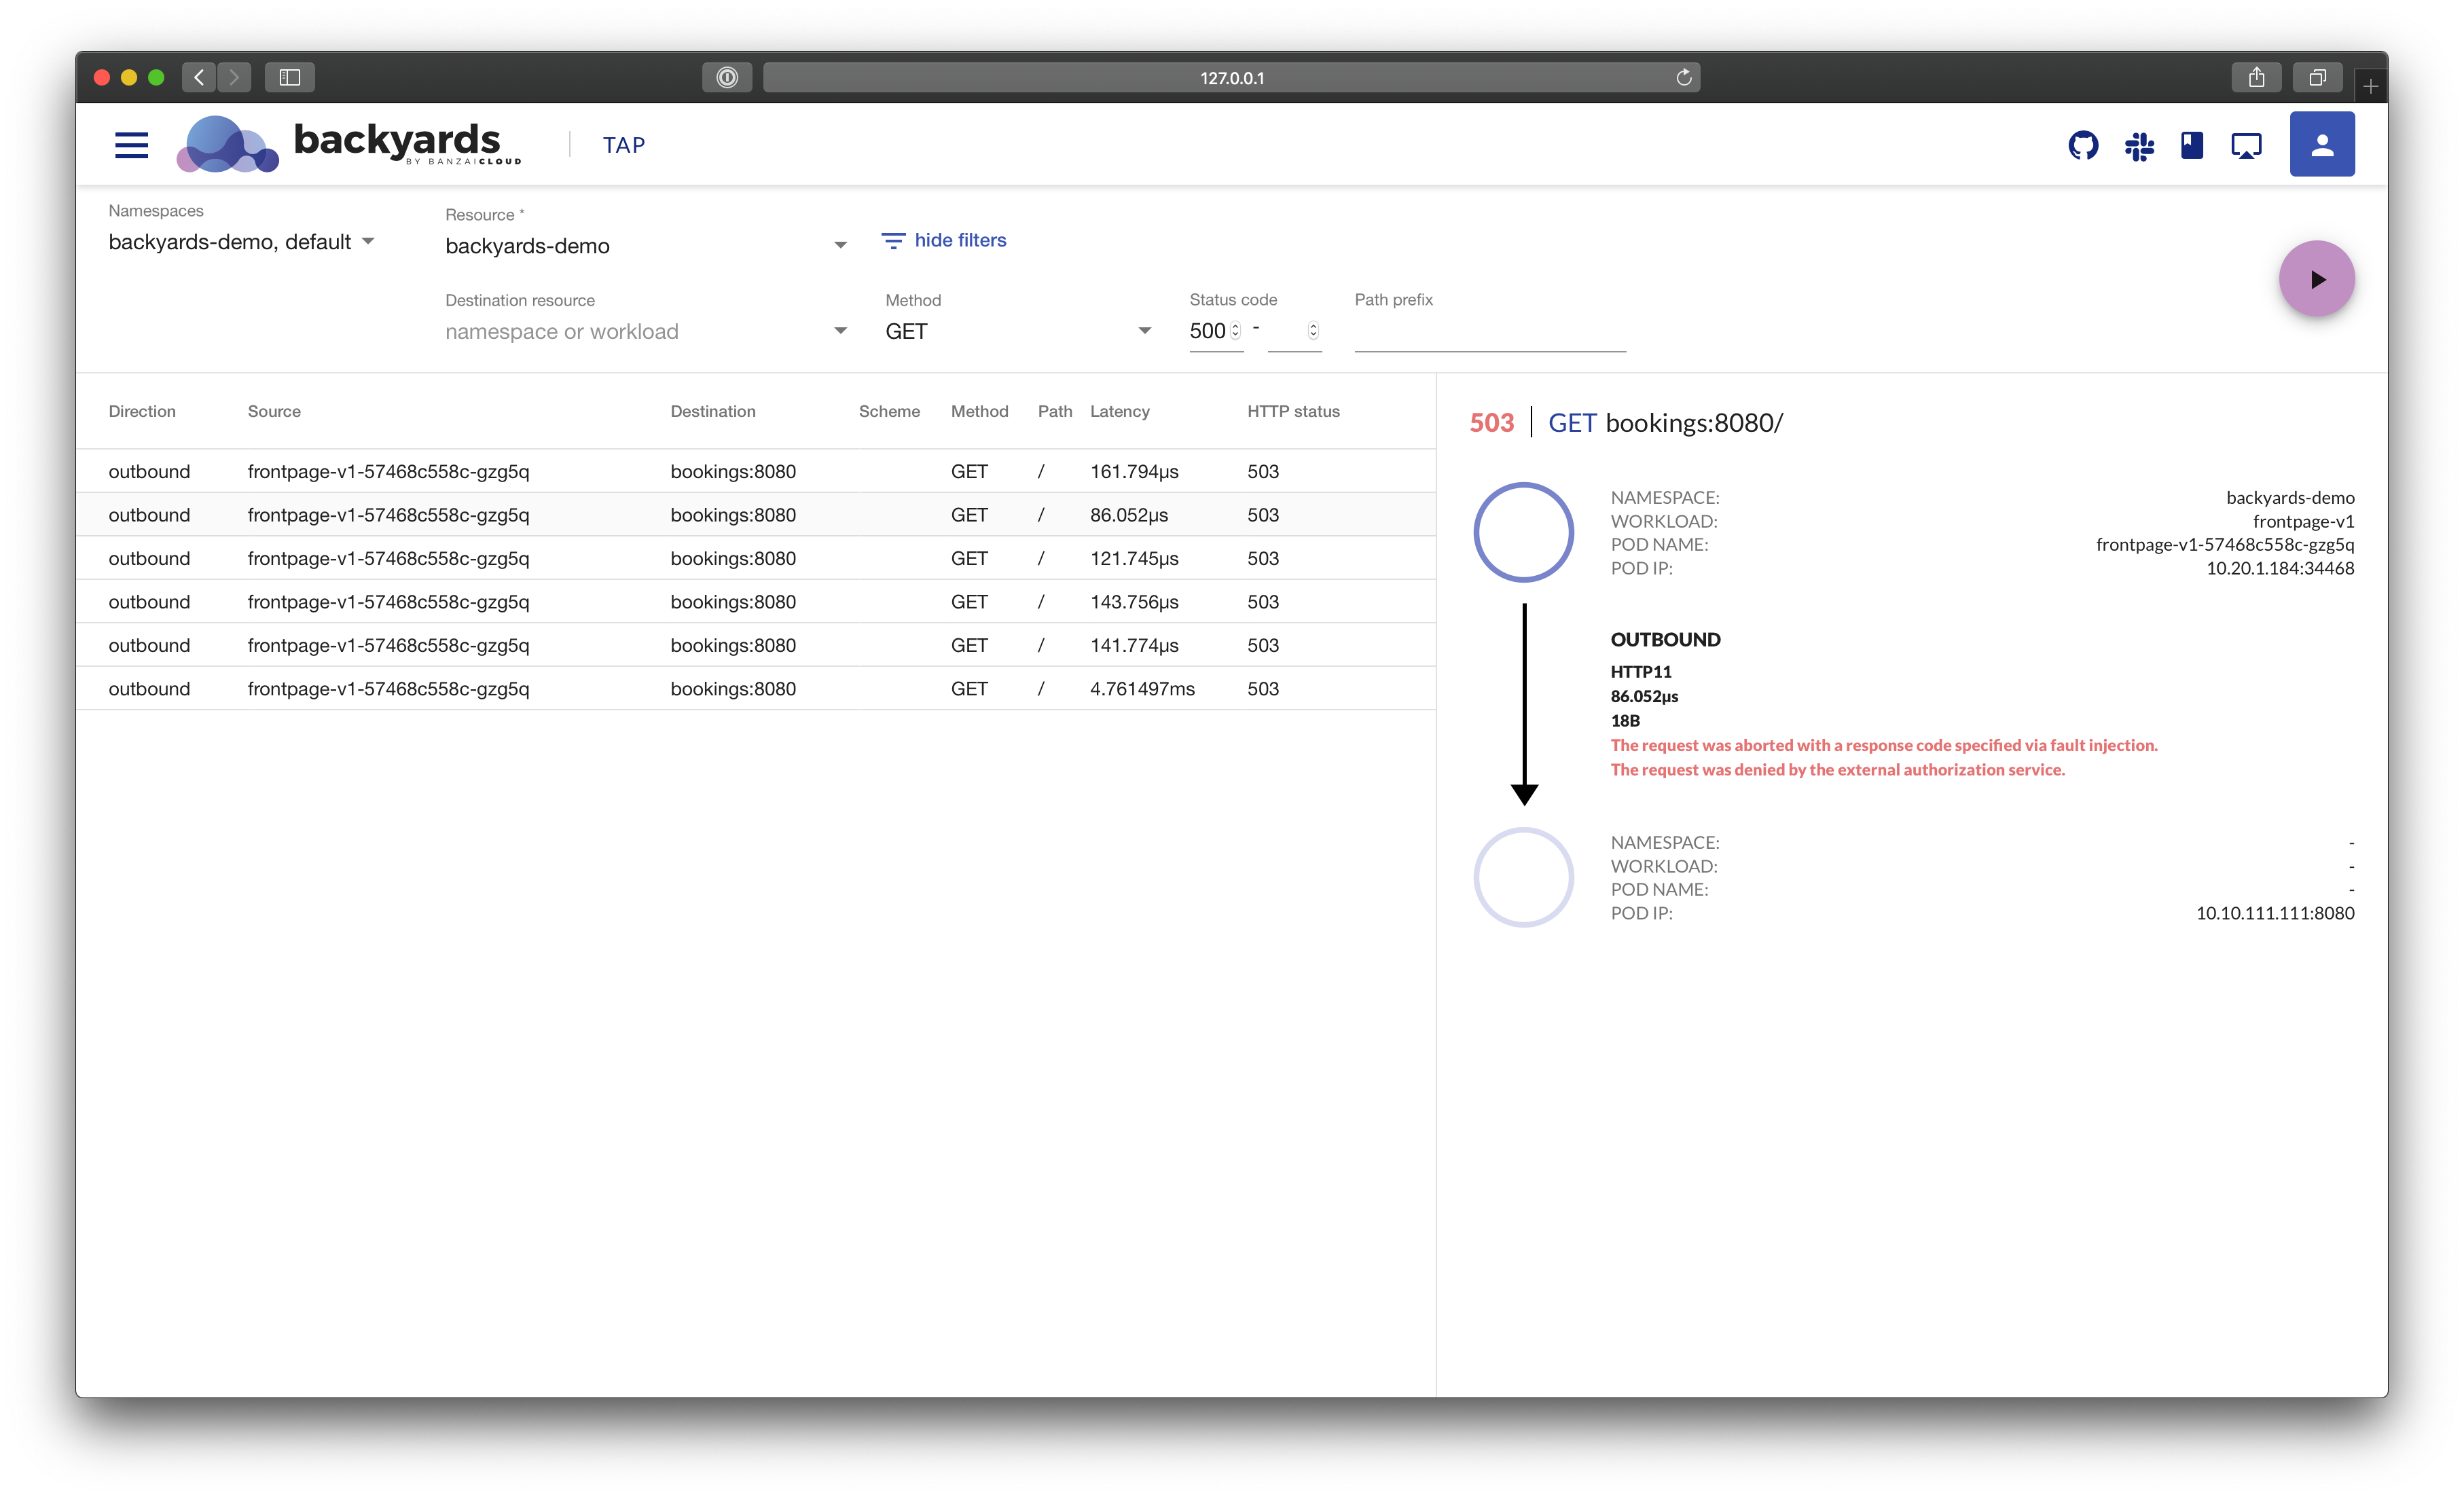
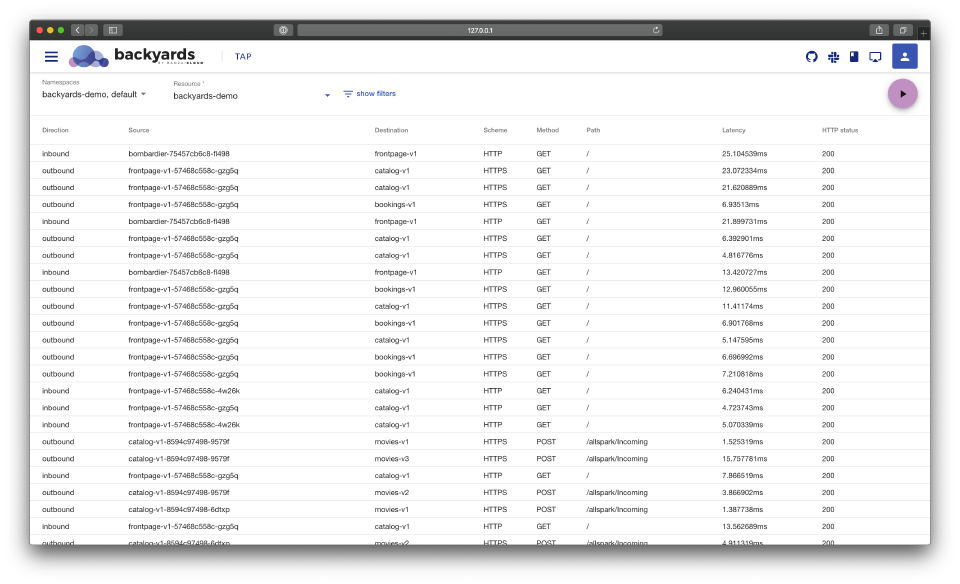
Using the Backyards UI 🔗︎
Traffic tap is also available from the dashboard.
Select the reporter Resource to start watching the traffic:
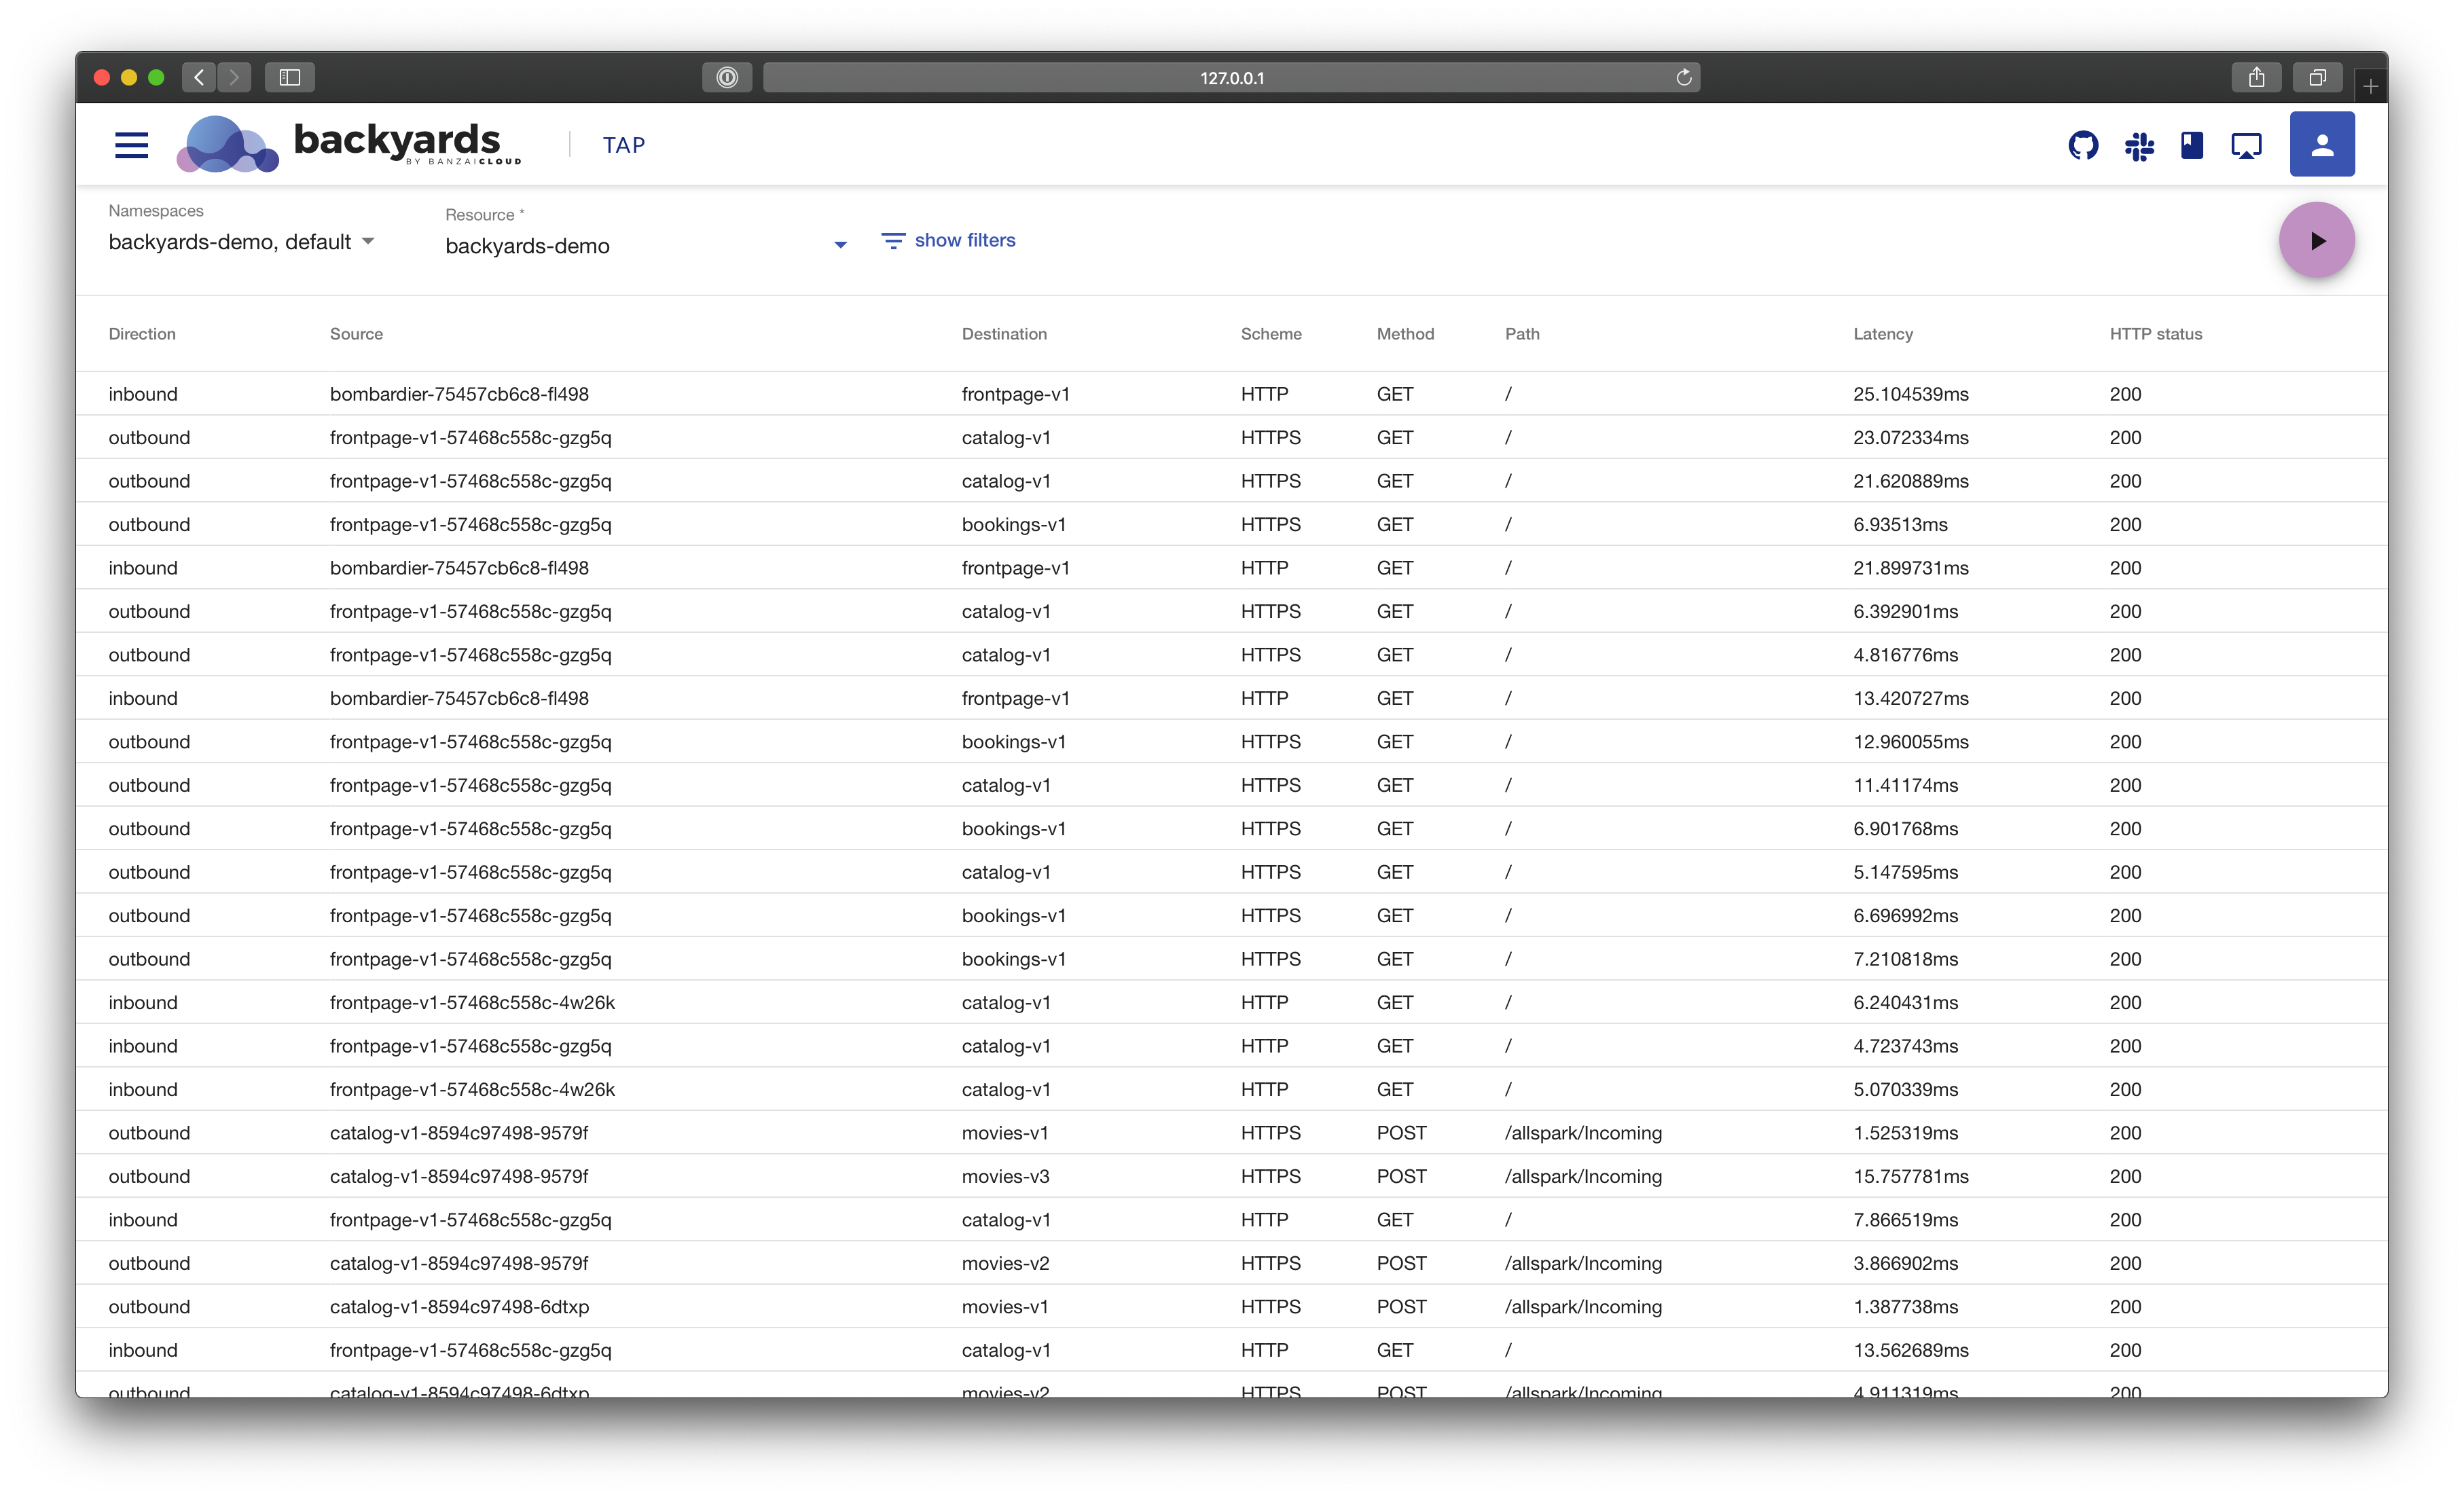
By clicking on show filters, you will be able to specify additional filters.
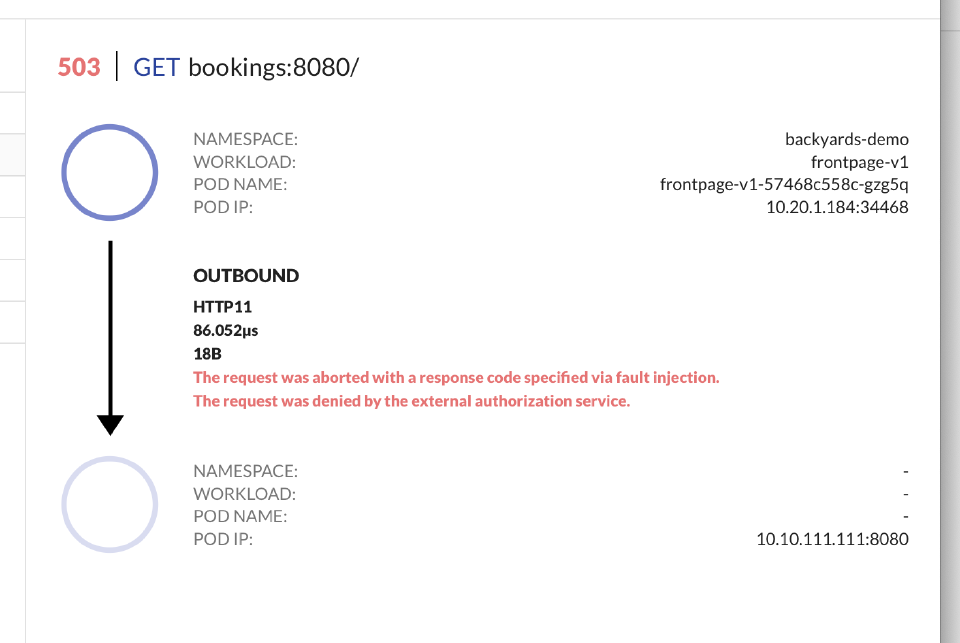
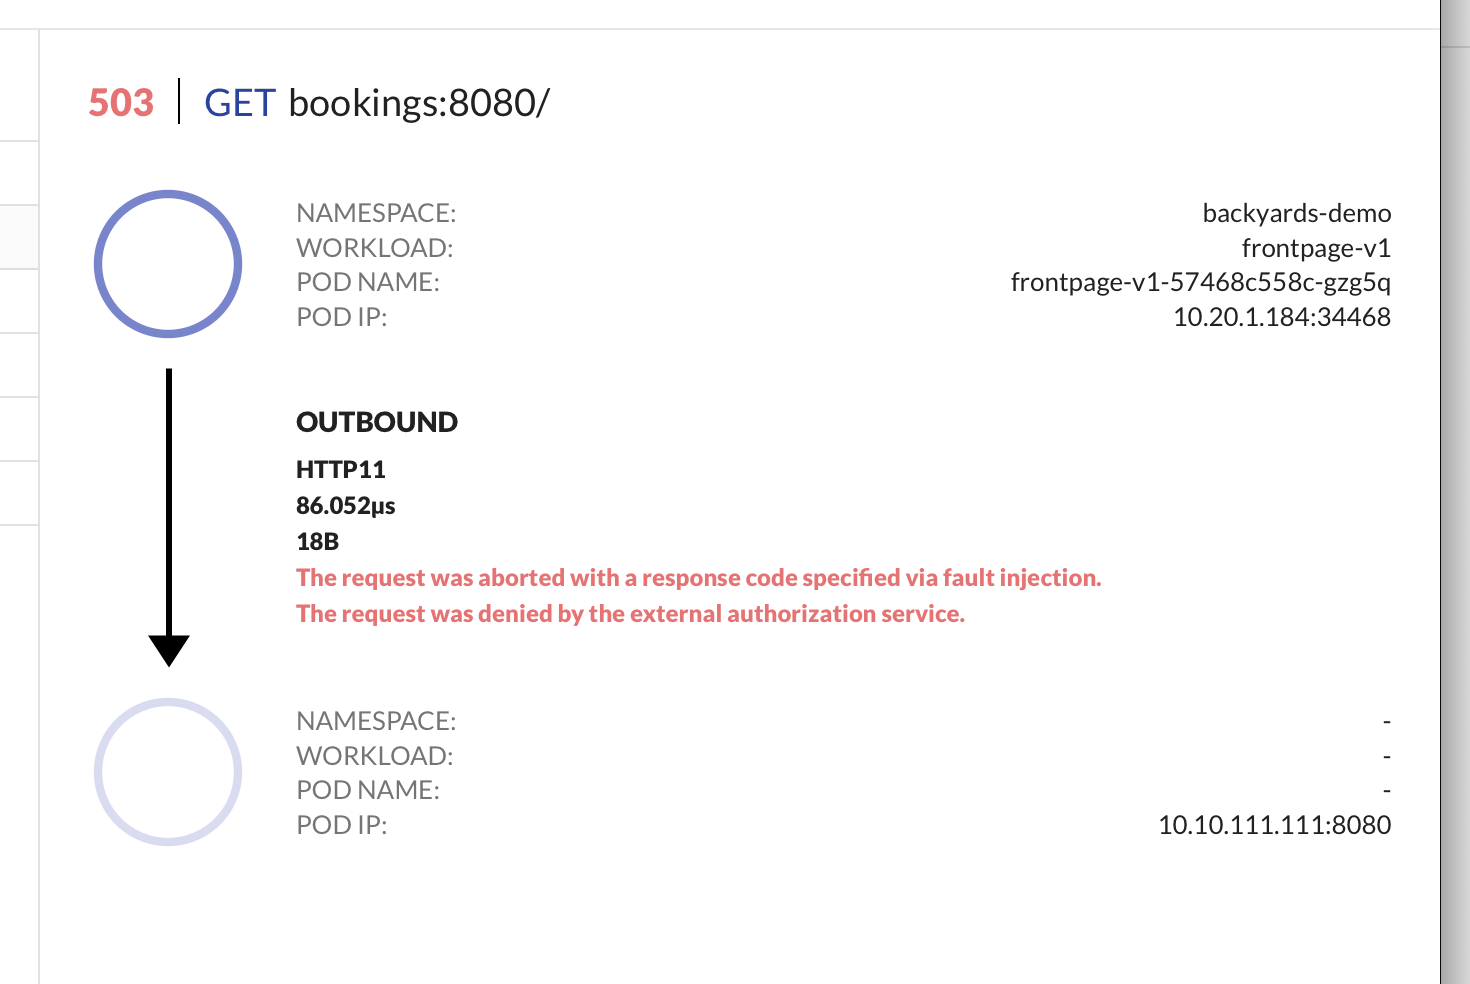
Select an individual log to see its details: