
What can I observe? 🔗︎
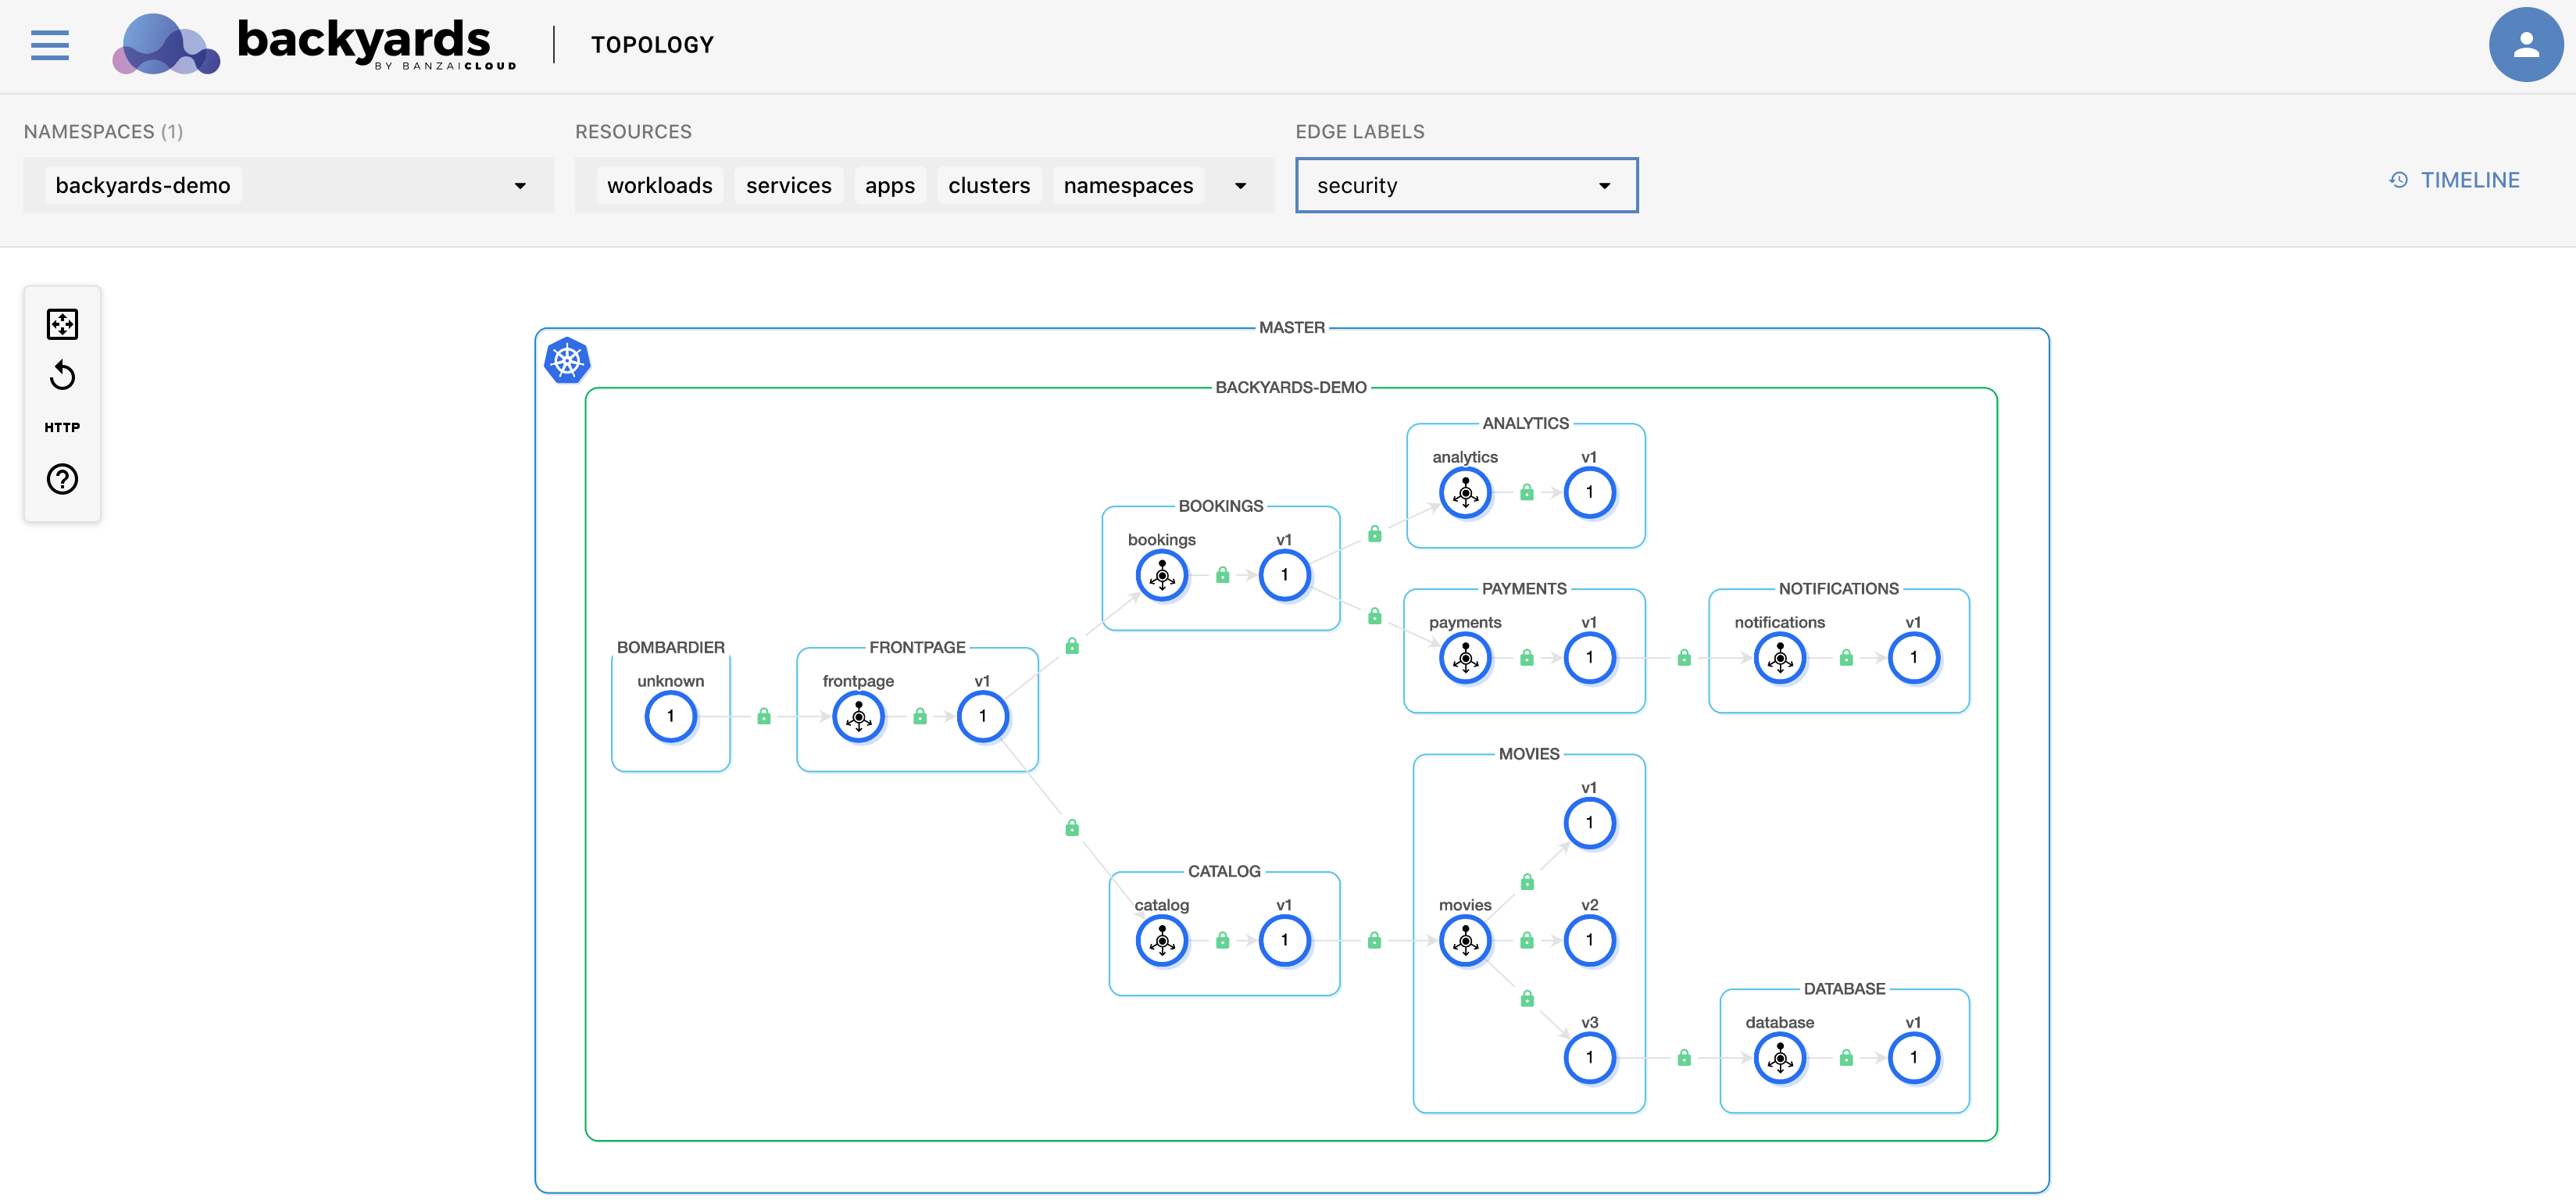
One of the main goals of Backyards is to give you an overview of your service mesh. You’ll see the topology of the services running in the mesh with real-time monitoring information of
- error rate,
- RPS,
- throughput, and
- latency.
You also get one-click access to distributed tracing with Jaeger, and Grafana dashboards if you want to further explore metrics provided by the service mesh. Backyards completes the service mesh metrics with a drill-down view of your services and workloads from their mesh configuration to pod and node-level info and metrics of resource utilization.
How do you help me debug my services? 🔗︎
A lot of different features exist in Backyards that help debugging your services. Usually you start by checking real-time error rates and latency values on the topology view, then go on with mesh validations, and the drill-down view of a service or workload. You also have 1-click access to Jaeger and Grafana dashboards if you want to further explore your traces and metrics. If you need to check requests flowing through an Envoy proxy, Backyards provides you a tapping feature to see access logs, or a detailed view of the requests.


