

Monitoring is an essential part of operating and observing Kubernetes clusters. Pipeline uses the CNCF graduated project Prometheus and Grafana to monitor Kubernetes clusters.
Collecting metrics with Prometheus 🔗︎
Prometheus is the most used solution to gather metrics from a Kubernetes cluster. By default it collects basic data from the nodes and kubernetes services.
Pipeline uses the Prometheus Operator to configure the different parts of monitoring. You can collect your own application’s metrics as well, just configure the ServiceMonitor custom resource for it. If you want to learn more about configuring Prometheus Operator please read the getting-started guide
If you enable monitoring, Pipeline installs the following components:
- Prometheus Operator
- Prometheus
- Alertmanager
- Basic Alerts (Cluster alerts)
- Basic Dashboards (Cluster metrics)
Dashboards 🔗︎
Pipeline provides Grafana dashboards out of box to overview your cluster and application health statuses. Each of the supported features comes with monitoring and dashboards as well.

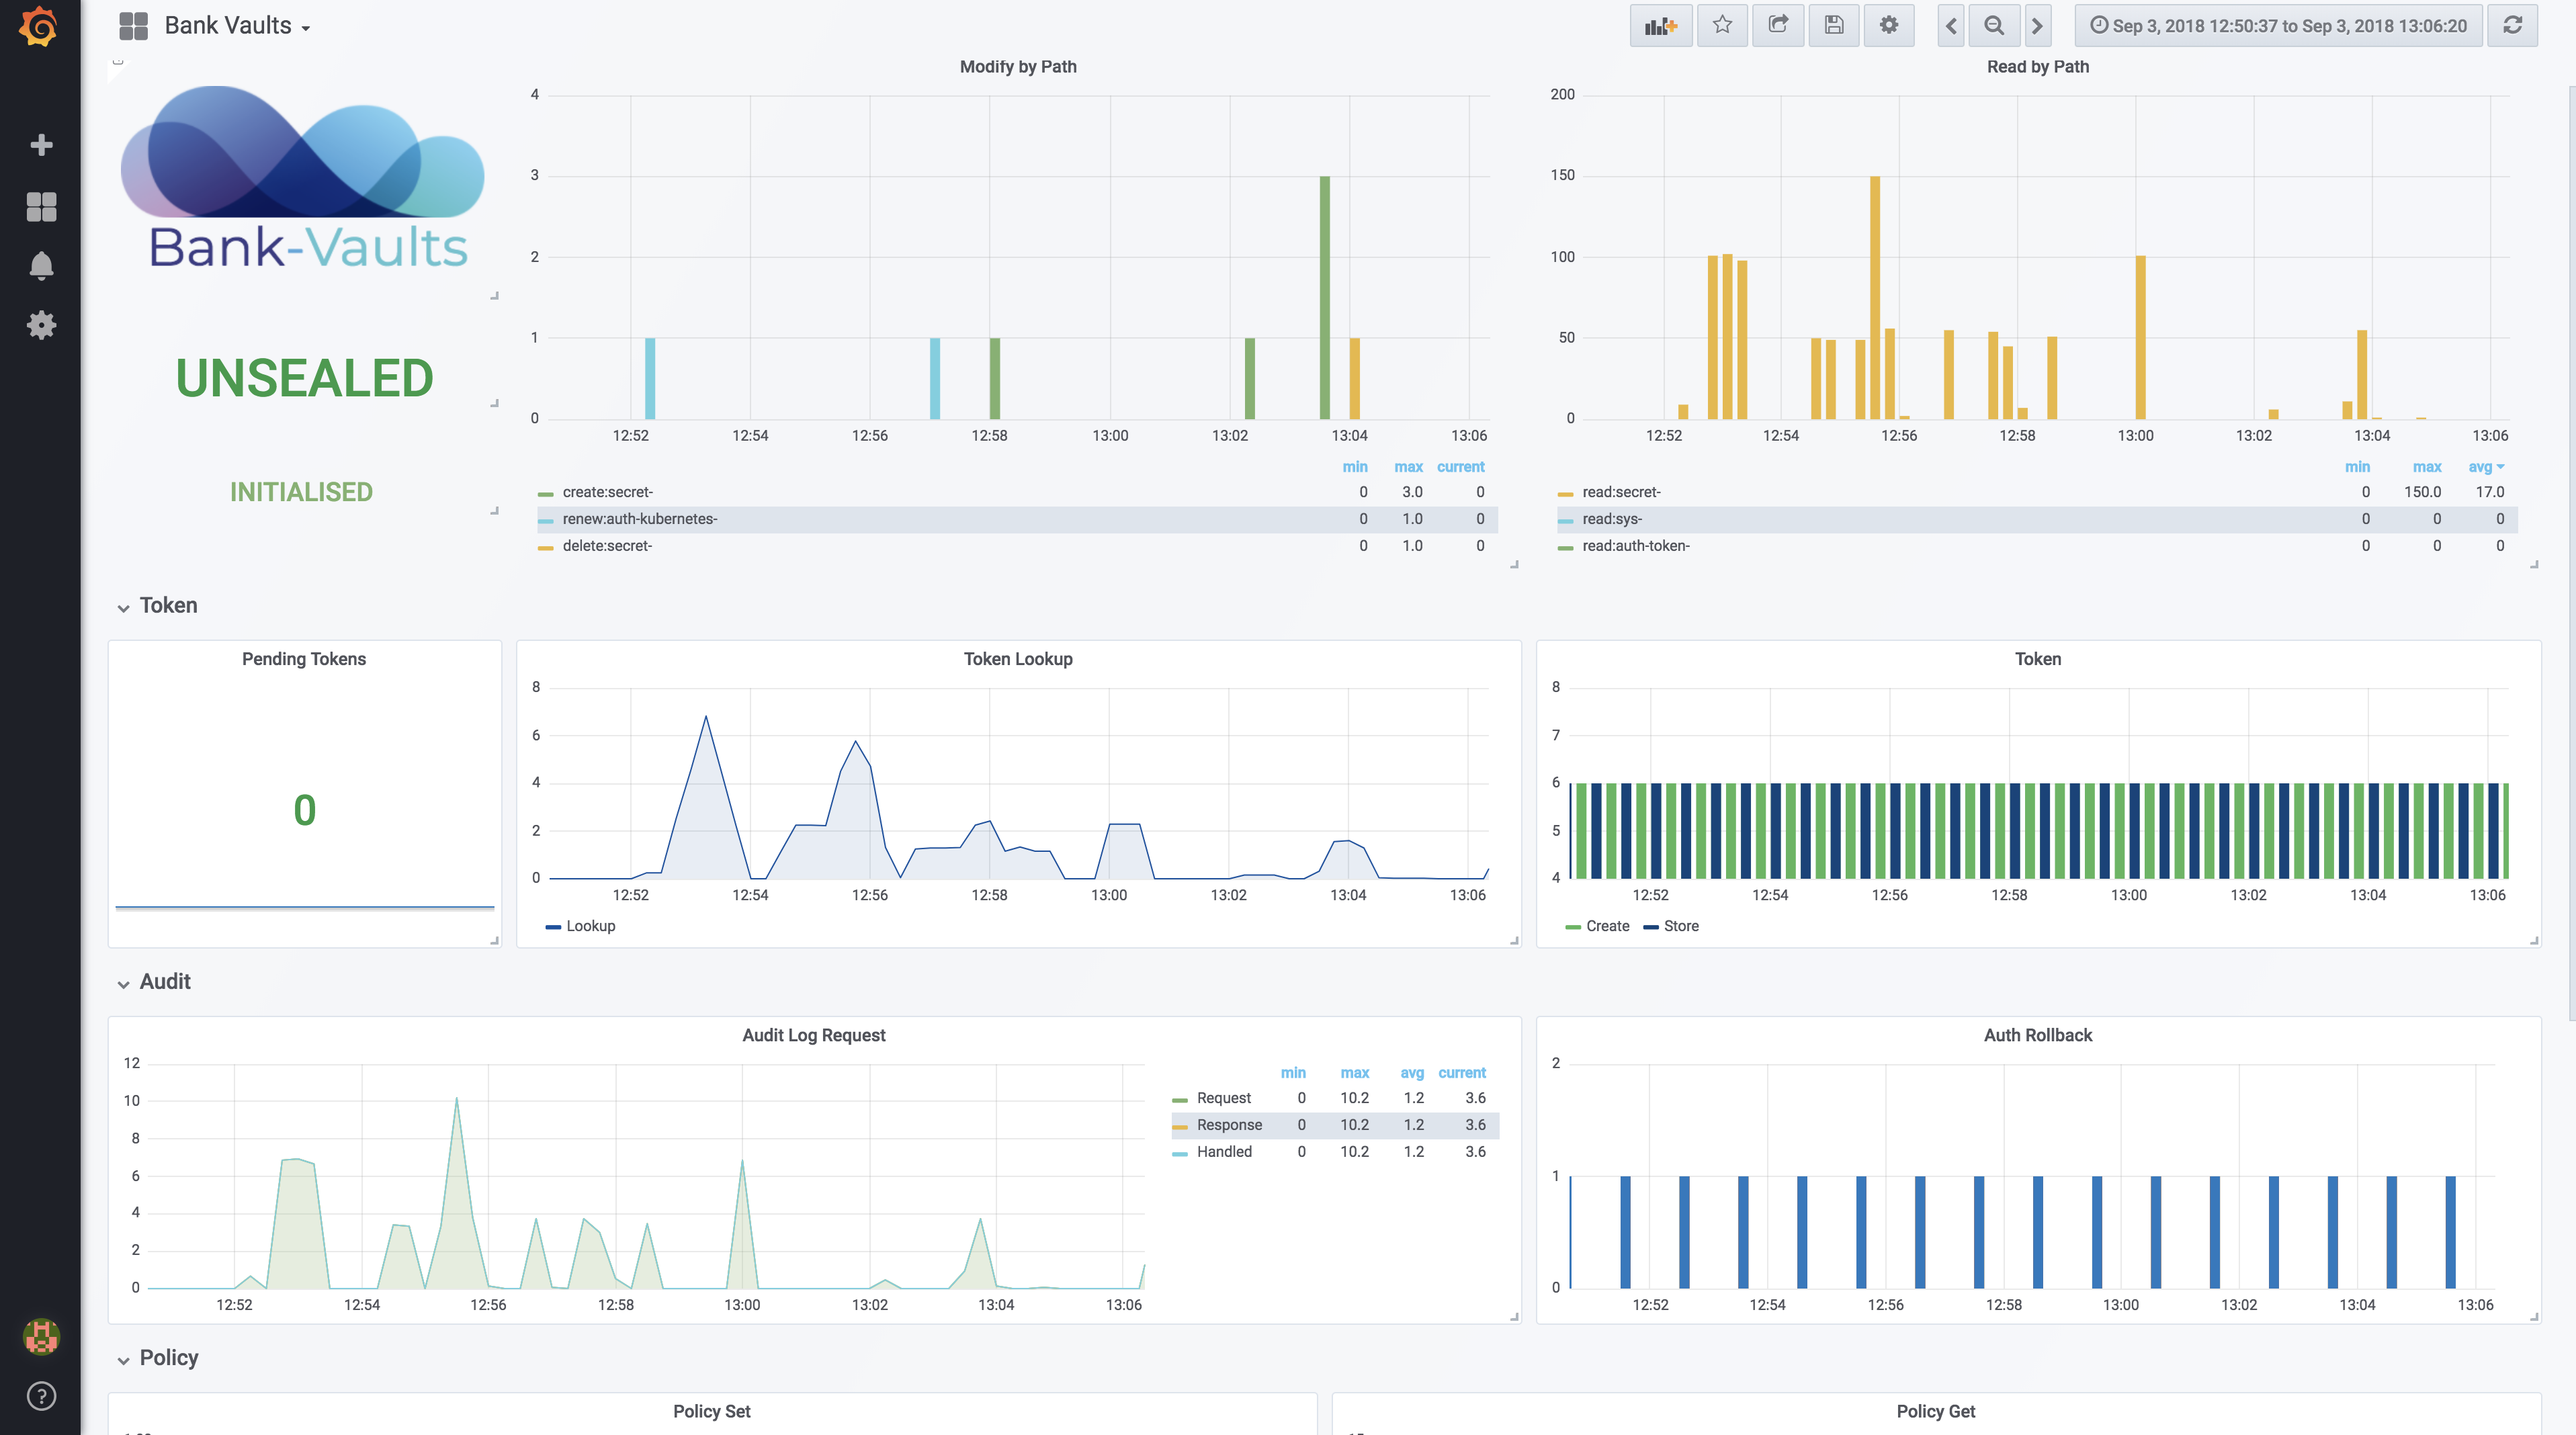 Screenshot of Bank-Vaults overview dashboard
Alerting 🔗︎
Pipeline Monitoring comes with a basic set of default alerts. These alerts are managed by Prometheus Alertmanager. You can find a broad range of configuration examples in the official documentation.
Pipeline supports the following notification methods:
Email 🔗︎
The following parameters are required to set-up e-mail notification.
| Parameter | Description |
|---|---|
| To | Destination of the alert message |
| From | Sender of the alert message |
| Send resolved | Send resolved notifications as well |
If you need more detailed configuration you can edit the CustomResources directly. See the prometheus-operator alerting guide for details.
Pagerduty 🔗︎
There is a detailed guide of PagerDuty prometheus integration
| Parameter | Description |
|---|---|
| Routing Key | The PagerDuty integration key (when using PagerDuty integration type Events API v2 |
| Service Key | The PagerDuty integration key (when using PagerDuty integration type Prometheus) |
| URL | PagerDuty service endpoint |
| Send resolved | Send resolved notifications as well |
Slack 🔗︎
Configuring Slack requires only a few parameters.
| Parameter | Description |
|---|---|
| API url | Slack url to send alerts to |
| Channel | Channel name for the alerts |
| Send resolved | Send resolved notifications as well |


