

Production-ready systems shouldn’t exist without a comprehensive solution for log collection. Banzai Cloud Pipeline’s Logging feature creates and manages a centralized logging solution for your Kubernetes clusters.
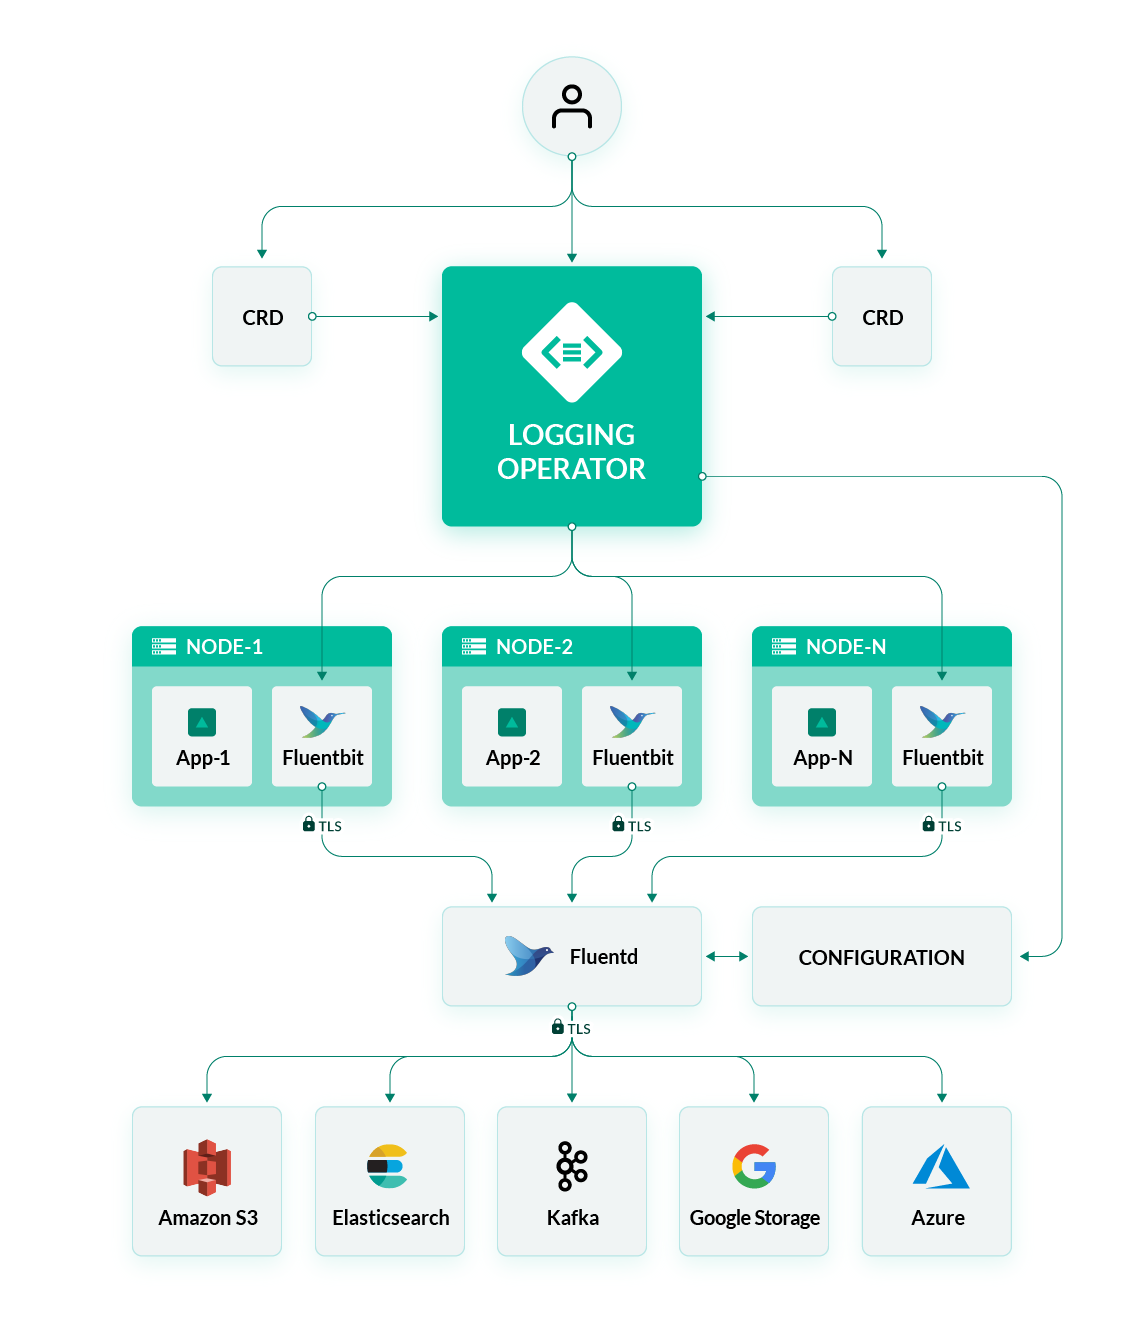
The log flows can be configured by instrumenting Banzai Cloud’s logging-operator. The operator utilizes the CNCF graduated fluentd and fluent-bit projects as main building blocks.
Collectors 🔗︎
The solution deploys Fluent-bit to your clusters as a DaemonSet, and uses its Kubernetes plugin to gather the container logs from the hosts. The logs are enriched with Kubernetes metadata, and transferred to an aggregator.
Aggregators 🔗︎
Aggregators are typically implemented by one or more fluentd instances.
Fluentd routes the logs based on their labels and namespaces.
These flows can be adjusted with filter plugins.
Outputs 🔗︎
At the end of the logging flows there is one or more output defined.
You can configure several outputs. These outputs are cluster wide configurations, which means that the logs of all pods in all namespaces are collected by default. For more granular configuration please check the detailed instructions for logging-operator.
Let’s take a look at some of the most used outputs.
ObjectStore 🔗︎
Saving logs to object storage is a the easiest way to archive logs. These logs are often compressed and stored as gzip in the default path layout:
logs/${tag}/%Y/%m/%d/
Where ${tag} is the fluentd tag and %Y/%m/%d/ is the year/month/day pattern.
The filename follows this pattern:
%{path}%{time_slice}_%{index}.%{file_extension}
The following object store outputs are supported currently:
- Amazon S3
- Google Cloud Storage — GCS
- Azure Storage
Loki 🔗︎
Loki is a project to provide on-demand log fetching for Kubernetes. It has two primary interfaces:
- Grafana — the main frontend for Loki
- Logcli — a command line tool
If you want to learn more about Loki please read our article about using it with our logging ecosystem.
Forward 🔗︎
There are many cases when you want to aggregate logs from more clusters. This output is a forwarder configuration to an external fluentd deployment.
Architecture 🔗︎
Metrics 🔗︎
The logging solution provides useful information about the logging stack. If you have monitoring enabled in your cluster you can check the predefined Grafana dashboards and set up Prometheus alerts as well.


