

This guide describes how to collect application and container logs in Kubernetes using the Logging operator, and how to send them to Grafana Loki.
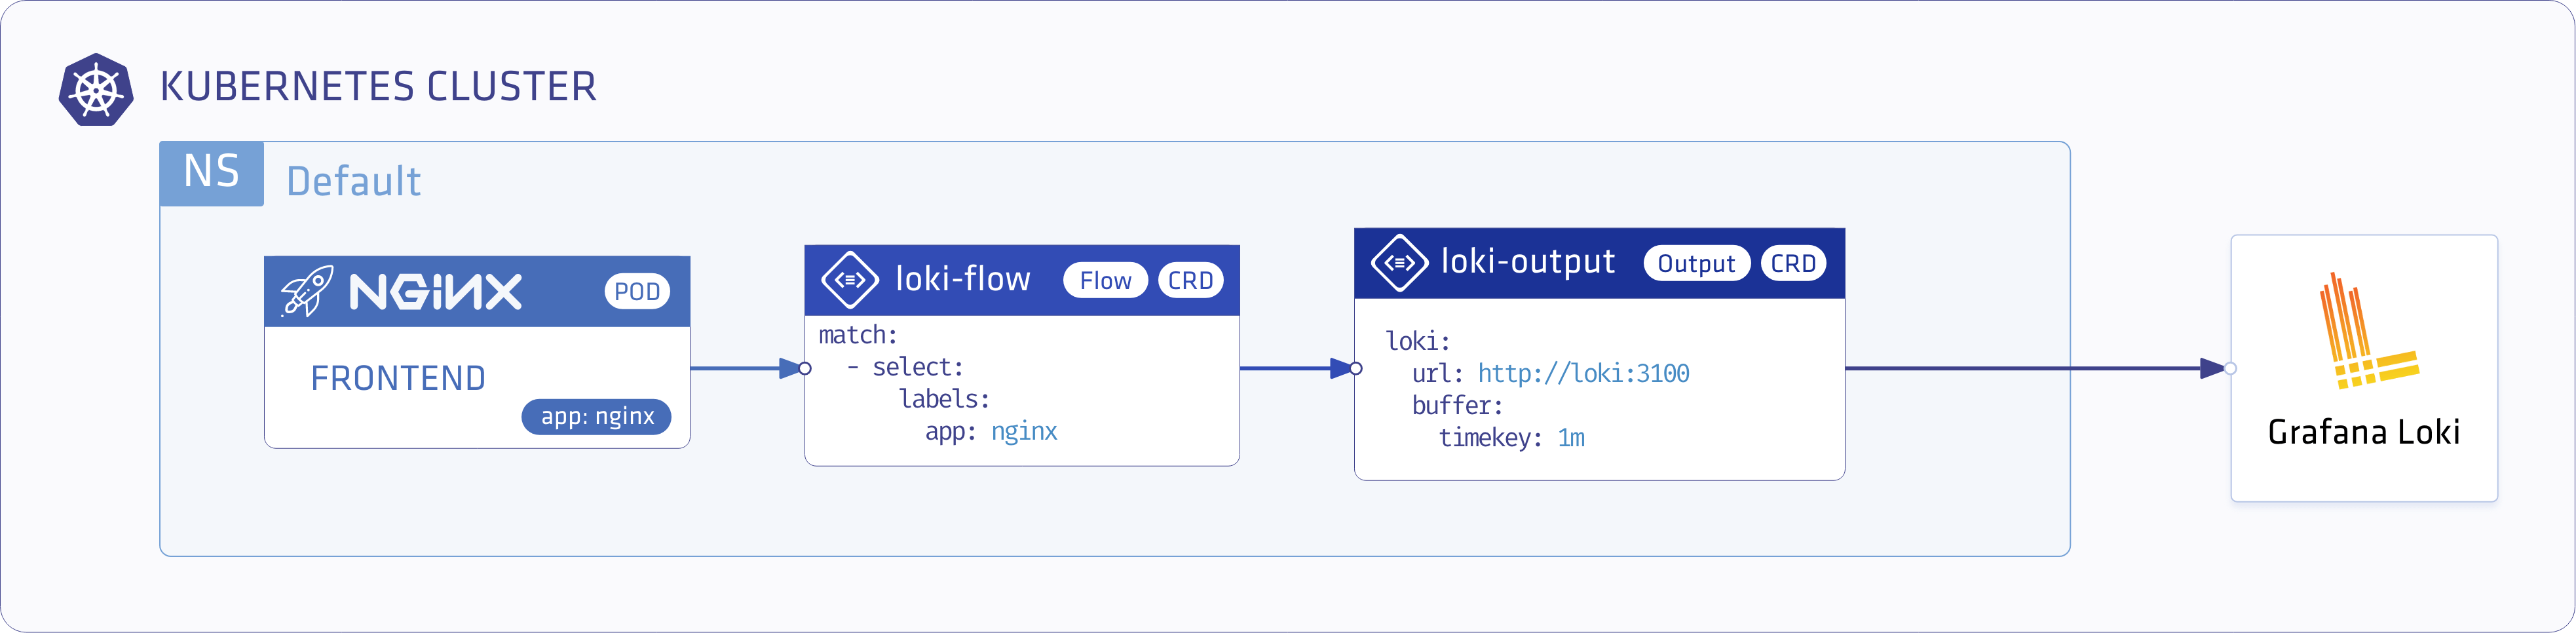
The following figure gives you an overview about how the system works. The Logging operator collects the logs from the application, selects which logs to forward to the output, and sends the selected log messages to the output. For more details about the Logging operator, see the Logging operator overview.
Deploy Loki and Grafana 🔗︎
-
Add the chart repositories of Loki and Grafana using the following commands:
helm repo add grafana https://grafana.github.io/helm-charts helm repo add loki https://grafana.github.io/loki/charts helm repo update -
Install Loki into the logging namespace:
helm upgrade --install --create-namespace --namespace logging loki loki/loki -
Install Grafana into the logging namespace:
 helm upgrade --install --create-namespace --namespace logging grafana grafana/grafana \
 --set "datasources.datasources\\.yaml.apiVersion=1" \
 --set "datasources.datasources\\.yaml.datasources[0].name=Loki" \
 --set "datasources.datasources\\.yaml.datasources[0].type=loki" \
 --set "datasources.datasources\\.yaml.datasources[0].url=http://loki:3100" \
 --set "datasources.datasources\\.yaml.datasources[0].access=proxy"
Deploy the Logging operator and a demo application 🔗︎
Install the Logging operator and a demo application to provide sample log messages.
Deploy the Logging operator with Helm 🔗︎
To install the Logging operator using Helm, complete these steps.
Note: For the Helm-based installation you need Helm v3.2.1 or later.
-
Add the chart repository of the Logging operator using the following commands:
helm repo add banzaicloud-stable https://kubernetes-charts.banzaicloud.com helm repo update -
Install the Logging operator into the logging namespace:
helm upgrade --install --wait --create-namespace --namespace logging logging-operator banzaicloud-stable/logging-operator -
Install the demo application and its logging definition.
helm upgrade --install --wait --create-namespace --namespace logging logging-demo banzaicloud-stable/logging-demo \ --set "loki.enabled=True" -
Create the
loggingresource.kubectl -n logging apply -f - <<"EOF" apiVersion: logging.banzaicloud.io/v1beta1 kind: Logging metadata: name: default-logging-simple spec: fluentd: {} fluentbit: {} controlNamespace: logging EOFNote: You can use the
ClusterOutputandClusterFlowresources only in thecontrolNamespace. -
Create a Loki
outputdefinition.kubectl -n logging apply -f - <<"EOF" apiVersion: logging.banzaicloud.io/v1beta1 kind: Output metadata: name: loki-output spec: loki: url: http://loki:3100 configure_kubernetes_labels: true buffer: timekey: 1m timekey_wait: 30s timekey_use_utc: true EOFNote: In production environment, use a longer
timekeyinterval to avoid generating too many objects. -
Create a
flowresource.kubectl -n logging apply -f - <<"EOF" apiVersion: logging.banzaicloud.io/v1beta1 kind: Flow metadata: name: loki-flow spec: filters: - tag_normaliser: {} - parser: remove_key_name_field: true reserve_data: true parse: type: nginx match: - select: labels: app.kubernetes.io/name: log-generator localOutputRefs: - loki-output EOF -
Install the demo application.
kubectl -n logging apply -f - <<"EOF"
apiVersion: apps/v1
kind: Deployment
metadata:
 name: log-generator
spec:
 selector:
   matchLabels:
     app.kubernetes.io/name: log-generator
 replicas: 1
 template:
   metadata:
     labels:
       app.kubernetes.io/name: log-generator
   spec:
     containers:
     - name: nginx
       image: banzaicloud/log-generator:0.3.2
EOF
Validate the deployment 🔗︎
Grafana Dashboard 🔗︎
-
Use the following command to retrieve the password of the Grafana
adminuser:kubectl get secret --namespace logging grafana -o jsonpath="{.data.admin-password}" | base64 --decode ; echo -
Enable port forwarding to the Grafana Service.
kubectl -n logging port-forward svc/grafana 3000:80 -
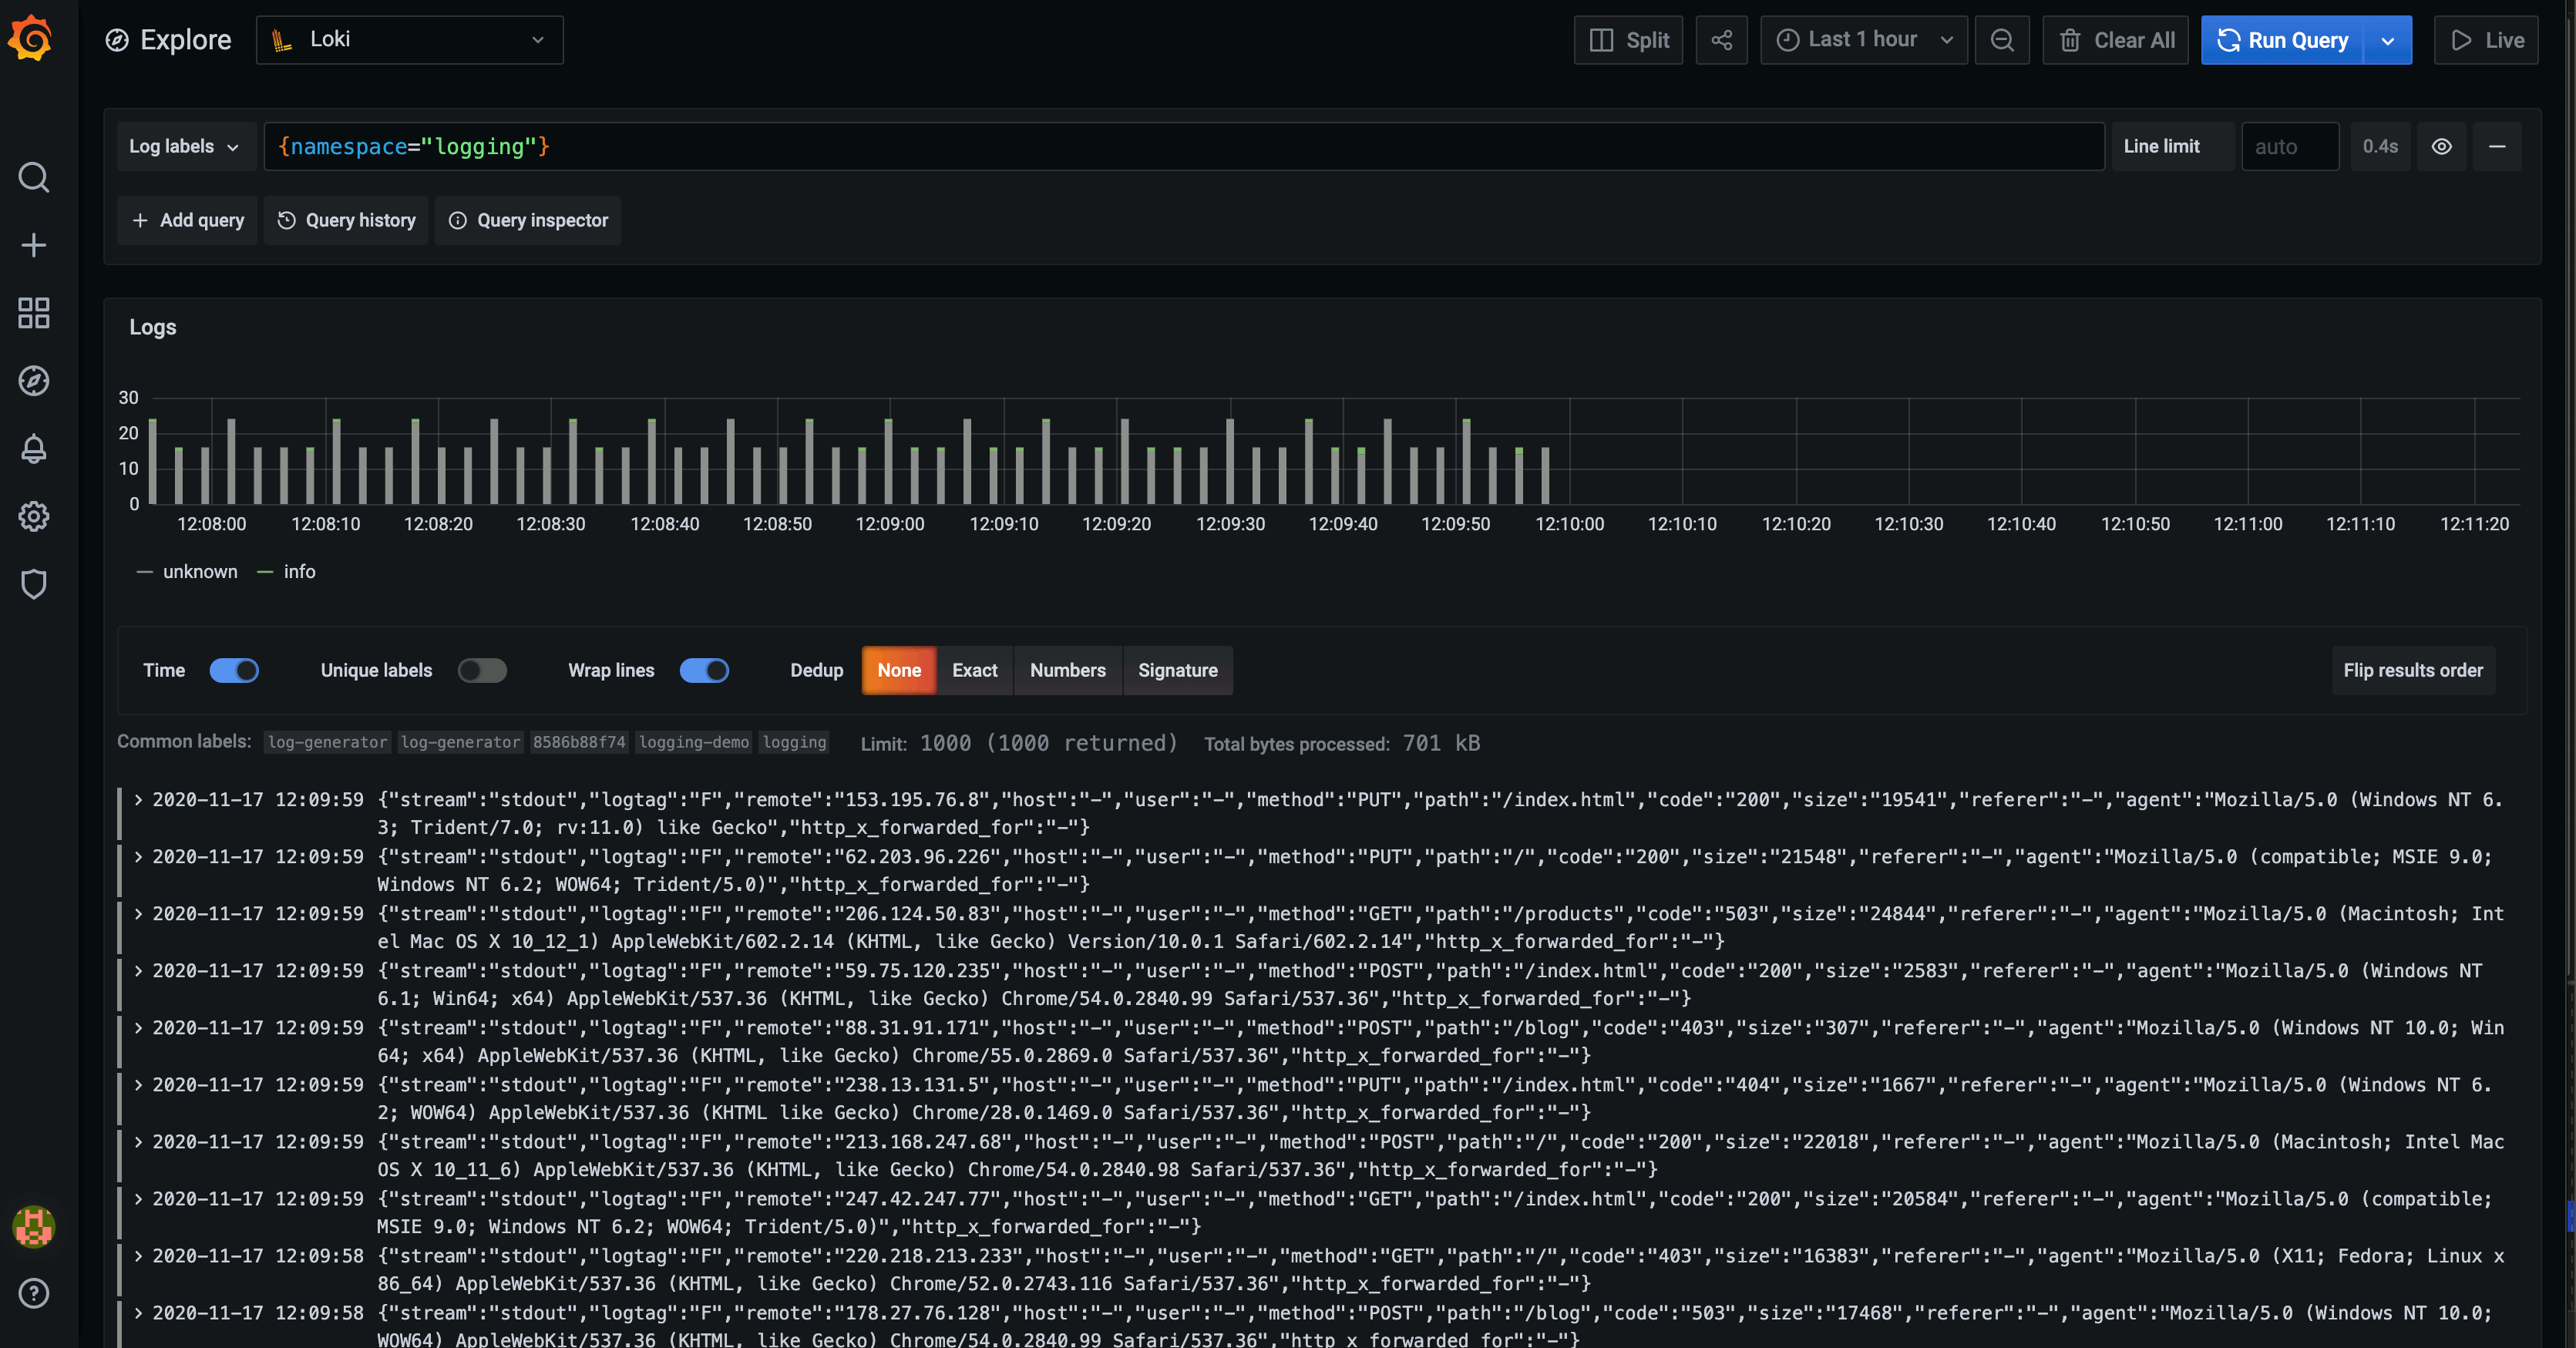
Open the Grafana Dashboard: http://localhost:3000
-
Use the
adminusername and the password retrieved in Step 1 to log in. -
Select Menu > Explore, select Data source > Loki, then select Log labels > namespace > logging. A list of logs should appear.
If you don’t get the expected result you can find help in the troubleshooting section.


