
This guide describes how to collect application and container logs in Kubernetes using the Logging operator, and how to send them to Elasticsearch.
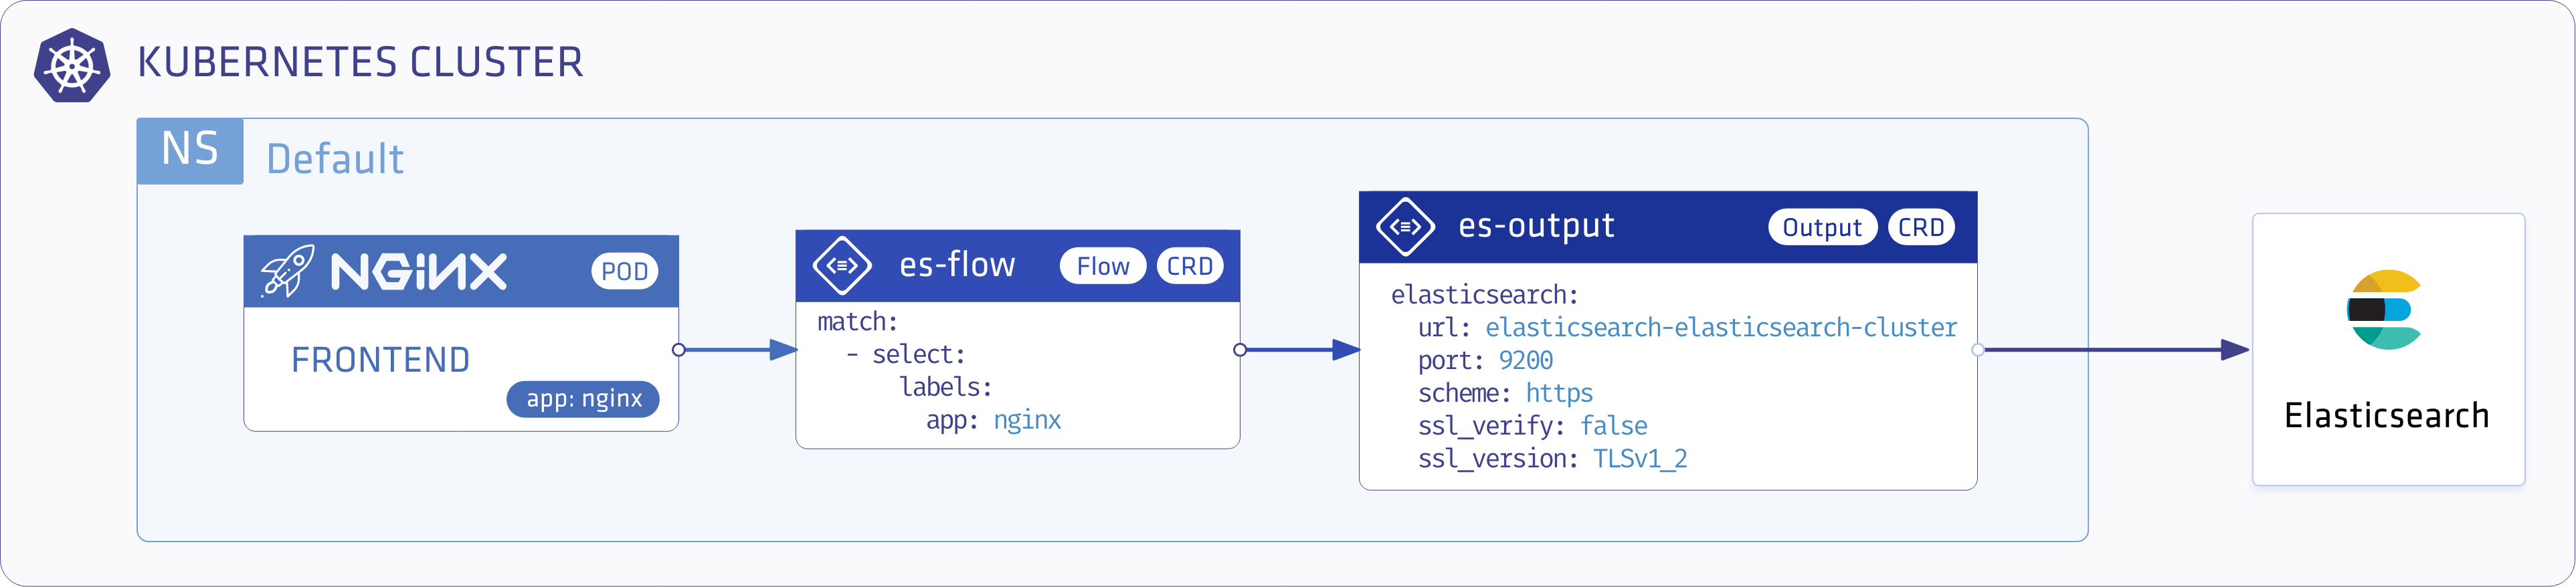
The following figure gives you an overview about how the system works. The Logging operator collects the logs from the application, selects which logs to forward to the output, and sends the selected log messages to the output. For more details about the Logging operator, see the Logging operator overview.
Deploy Elasticsearch 🔗︎
First, deploy Elasticsearch in your Kubernetes cluster. The following procedure is based on the Elastic Cloud on Kubernetes quickstart, but there are some minor configuration changes, and we install everything into the logging namespace.
-
Install the Elasticsearch operator.
kubectl apply -f https://download.elastic.co/downloads/eck/1.3.0/all-in-one.yaml -
Create the
loggingNamespace.kubectl create ns logging -
Install the Elasticsearch cluster into the logging namespace.
cat <<EOF | kubectl apply -n logging -f - apiVersion: elasticsearch.k8s.elastic.co/v1 kind: Elasticsearch metadata: name: quickstart spec: version: 7.10.0 nodeSets: - name: default count: 1 config: node.master: true node.data: true node.ingest: true node.store.allow_mmap: false EOF -
Install Kibana into the logging namespace.
cat <<EOF | kubectl apply -n logging -f -
apiVersion: kibana.k8s.elastic.co/v1
kind: Kibana
metadata:
  name: quickstart
spec:
  version: 7.10.0
  count: 1
  elasticsearchRef:
    name: quickstart
EOF
Deploy the Logging operator and a demo Application 🔗︎
Install the Logging operator and a demo application to provide sample log messages.
Deploy the Logging operator with Helm 🔗︎
To install the Logging operator using Helm, complete these steps.
Note: For the Helm-based installation you need Helm v3.2.1 or later.
-
Add the chart repository of the Logging operator using the following commands:
helm repo add banzaicloud-stable https://kubernetes-charts.banzaicloud.com helm repo update -
Install the Logging operator into the logging namespace:
helm upgrade --install --wait --create-namespace --namespace logging logging-operator banzaicloud-stable/logging-operator -
Install the demo application and its logging definition.
helm upgrade --install --wait --create-namespace --namespace logging logging-demo banzaicloud-stable/logging-demo \
  --set "elasticsearch.enabled=True"
Configure the Logging operator 🔗︎
-
Create the
loggingresource.kubectl -n logging apply -f - <<"EOF" apiVersion: logging.banzaicloud.io/v1beta1 kind: Logging metadata: name: default-logging-simple spec: fluentd: {} fluentbit: {} controlNamespace: logging EOFNote: You can use the
ClusterOutputandClusterFlowresources only in thecontrolNamespace. -
Create an Elasticsearch
outputdefinition.kubectl -n logging apply -f - <<"EOF" apiVersion: logging.banzaicloud.io/v1beta1 kind: Output metadata: name: es-output spec: elasticsearch: host: quickstart-es-http.logging.svc.cluster.local port: 9200 scheme: https ssl_verify: false ssl_version: TLSv1_2 user: elastic password: valueFrom: secretKeyRef: name: quickstart-es-elastic-user key: elastic buffer: timekey: 1m timekey_wait: 30s timekey_use_utc: true EOFNote: In production environment, use a longer
timekeyinterval to avoid generating too many objects. -
Create a
flowresource.kubectl -n logging apply -f - <<"EOF" apiVersion: logging.banzaicloud.io/v1beta1 kind: Flow metadata: name: es-flow spec: filters: - tag_normaliser: {} - parser: remove_key_name_field: true reserve_data: true parse: type: nginx match: - select: labels: app.kubernetes.io/name: log-generator localOutputRefs: - es-output EOF -
Install the demo application.
kubectl -n logging apply -f - <<"EOF"
apiVersion: apps/v1
kind: Deployment
metadata:
 name: log-generator
spec:
 selector:
   matchLabels:
     app.kubernetes.io/name: log-generator
 replicas: 1
 template:
   metadata:
     labels:
       app.kubernetes.io/name: log-generator
   spec:
     containers:
     - name: nginx
       image: banzaicloud/log-generator:0.3.2
EOF
Validate the deployment 🔗︎
To validate that the deployment was successful, complete the following steps.
-
Use the following command to retrieve the password of the
elasticuser:kubectl -n logging get secret quickstart-es-elastic-user -o=jsonpath='{.data.elastic}' | base64 --decode; echo -
Enable port forwarding to the Kibana Dashboard Service.
kubectl -n logging port-forward svc/quickstart-kb-http 5601 -
Open the Kibana dashboard in your browser at https://localhost:5601 and login as elastic using the retrieved password.
-
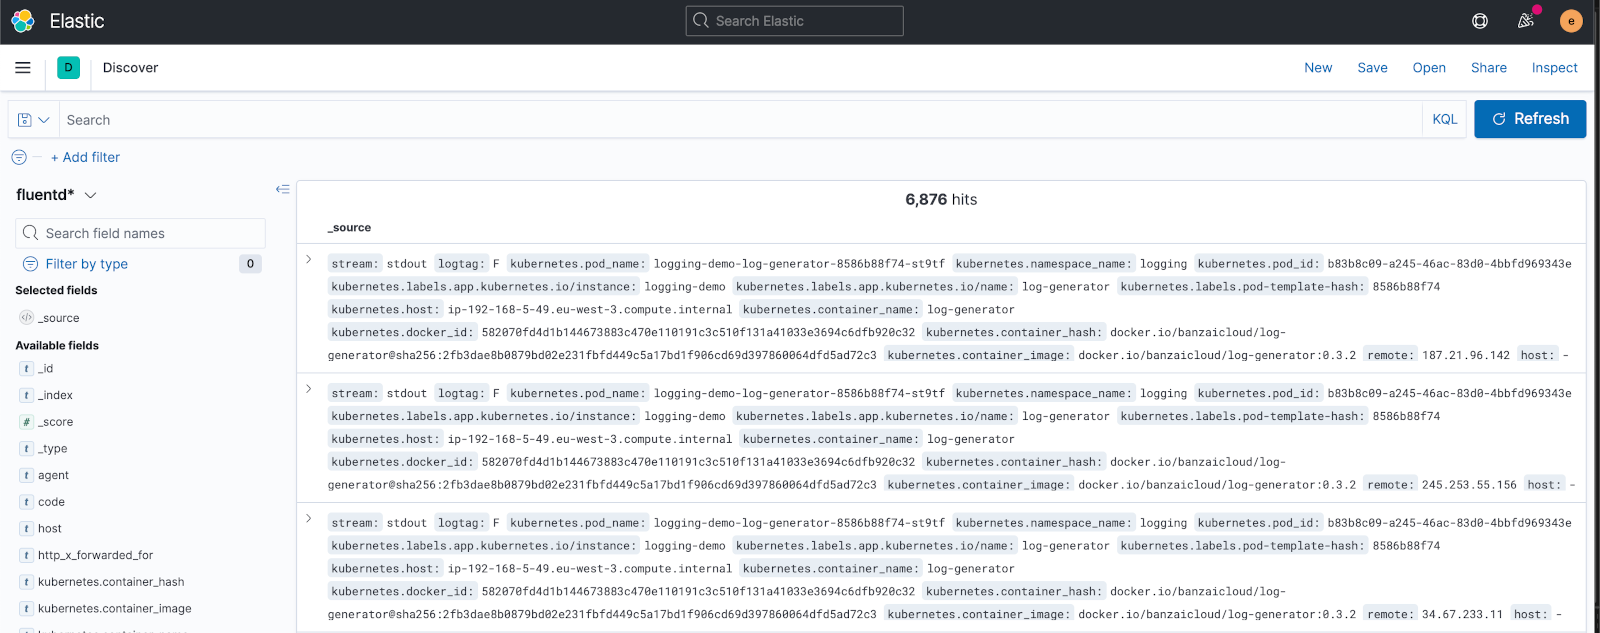
By default, the Logging operator sends the incoming log messages into an index called fluentd. Create an Index Pattern that includes this index (for example, fluentd*), then select Menu > Kibana > Discover. You should see the dashboard and some sample log messages from the demo application.
If you don’t get the expected result you can find help in the troubleshooting section.


