
Using the One Eye web UI, you can drill-down from the alert, service, or workload level, and trace back an issue by navigating deeper in the stack, and see the status and most important metrics of your Kubernetes controllers, pods, and nodes.
List of services 🔗︎
The MENU > SERVICES page contains information about the services your logging infrastructure collects data from.
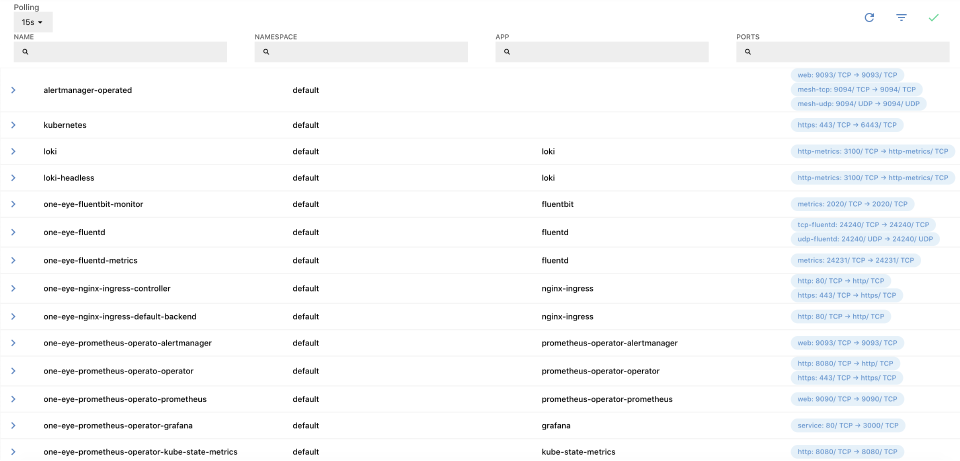

The list displays the following information about the services:
-
Name: The name of the service.
-
Namespace: The namespace the service belongs to.
-
APP: The application exposed using the service.
-
PORTS: The ports where the service is accessible, for example:
dns: 53/ UDP → 53/ UDP
dns-tcp: 53/ TCP → 53/ TCP
metrics: 9153/ TCP → 9153/ TCP
To quickly find a service, or to filter the list to show only services that match a criteria, click
to display the filter bar.
Click on the name of a service to display its details.
From the services list, you can drill down through the following levels to the underlying resources of the infrastructure: List of services > Service > Pod > Node
Service details 🔗︎
Select a Service from the list to display its details.
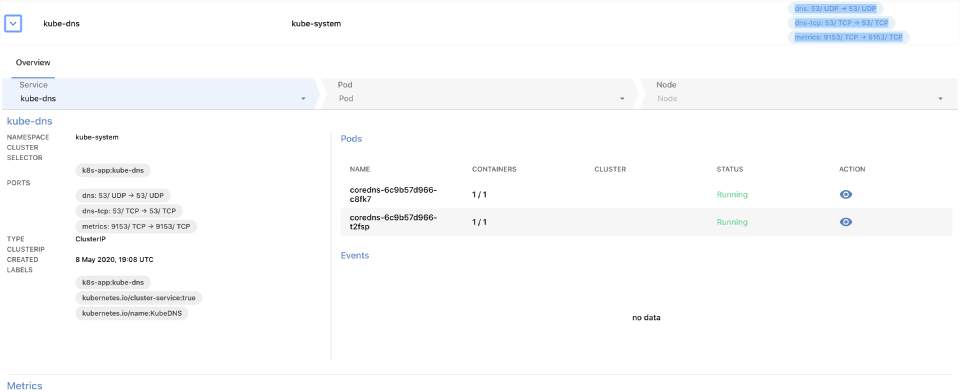

The following details of the service are displayed:
-
Service: The services exposed in this resource. Click on the name of the service to display the details of the service.
-
Namespace: The namespace the service belongs to.
-
CLUSTER: The name of the Kubernetes cluster the service belongs to.
-
SELECTOR: The label selector used to select the set of Pods targeted by the Service.
-
PORTS: The ports where the service is accessible, for example:
http 8080/TCP → 8080 grpc 8082/TCP → 8082 tcp 8083/TCP → 8083 -
TYPE: The ServiceType how your service is exposed, for example, ClusterIP or LoadBalancer.
-
CLUSTER IP: The IP address corresponding to the ServiceType.
-
CREATED: The date when the service was started.
-
LABELS: The list of Kubernetes labels assigned to the resource.
-
Pods: The list of pods running this service, including their name, number of containers in the pod, and their status. Click on the name of the pod to display the details of the pod.
-
Events: Recent events related to the resource.
Pod details 🔗︎
To check the details of a pod, click the name of the pod in the PODS section.

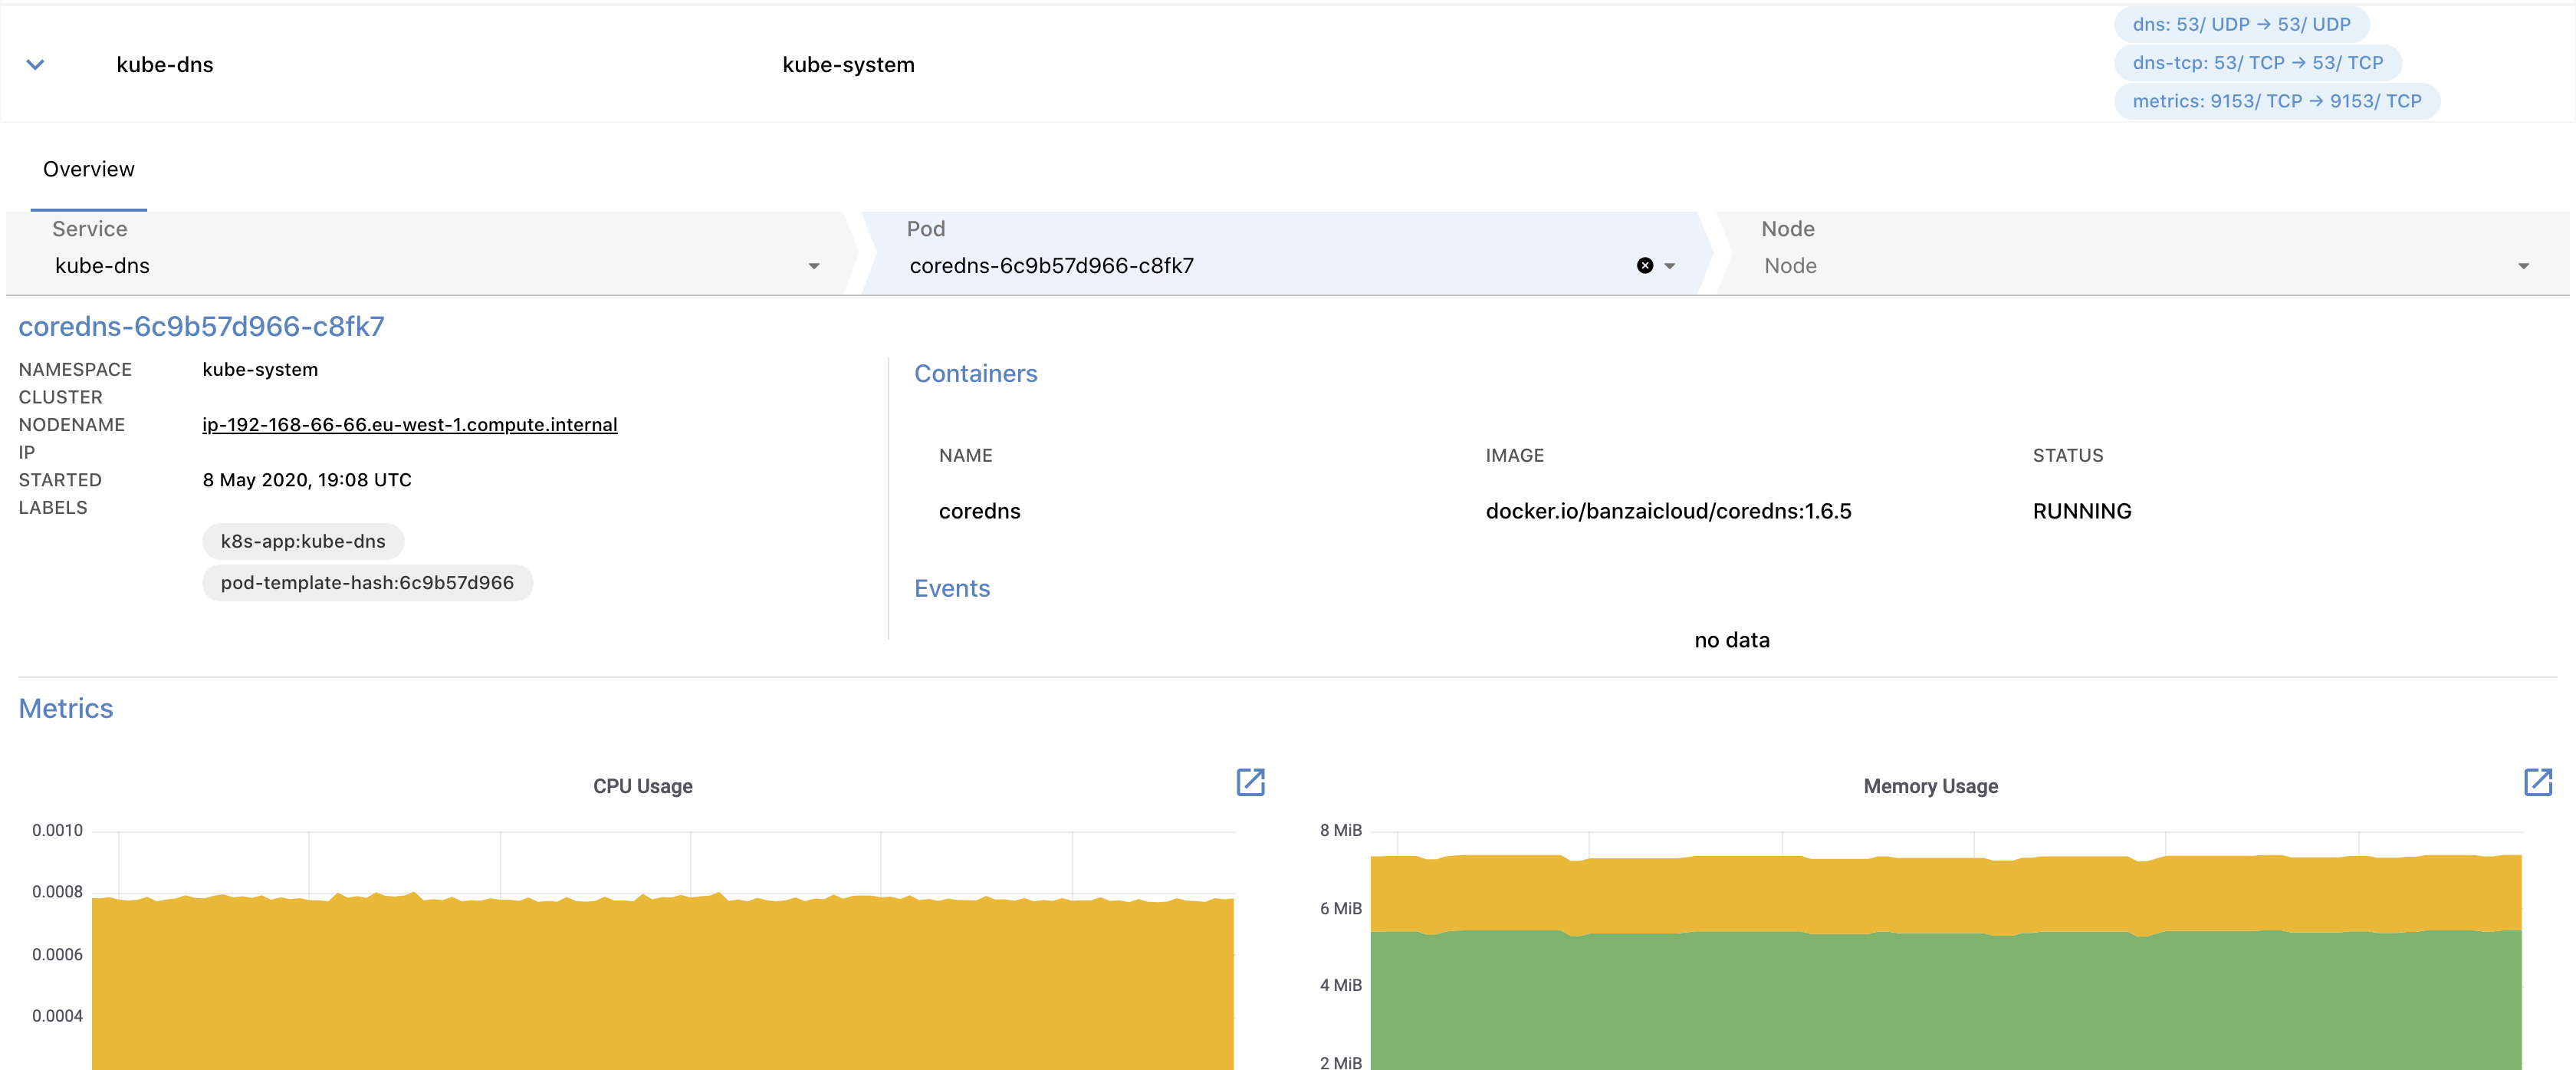
The following details of the pod are displayed:
- NAMESPACE: The namespace the pod belongs to.
- CLUSTER: The name of the Kubernetes cluster the pod belongs to.
- NODE: The hostname of the node the pod is running on, for example, ip-192-168-1-1.us-east-2.compute.internal. Click on the name of the node to display the details of the node.
- IP: The IP address of the pod.
- STARTED: The date when the pod was started.
- LABELS: The list of Kubernetes labels assigned to the resource.
- Containers: The list of containers in the pod. Also includes the Name, Image, and Status of the container.
- Events: Recent events related to the resource.
- Metrics: Dashboards of the most important metrics. Click
 to open the related dashboards in Grafana.
Node details 🔗︎
To check the details of a node, select a node in the pod details view. The node view is the deepest layer of the drill-down view and shows information about a Kubernetes node.
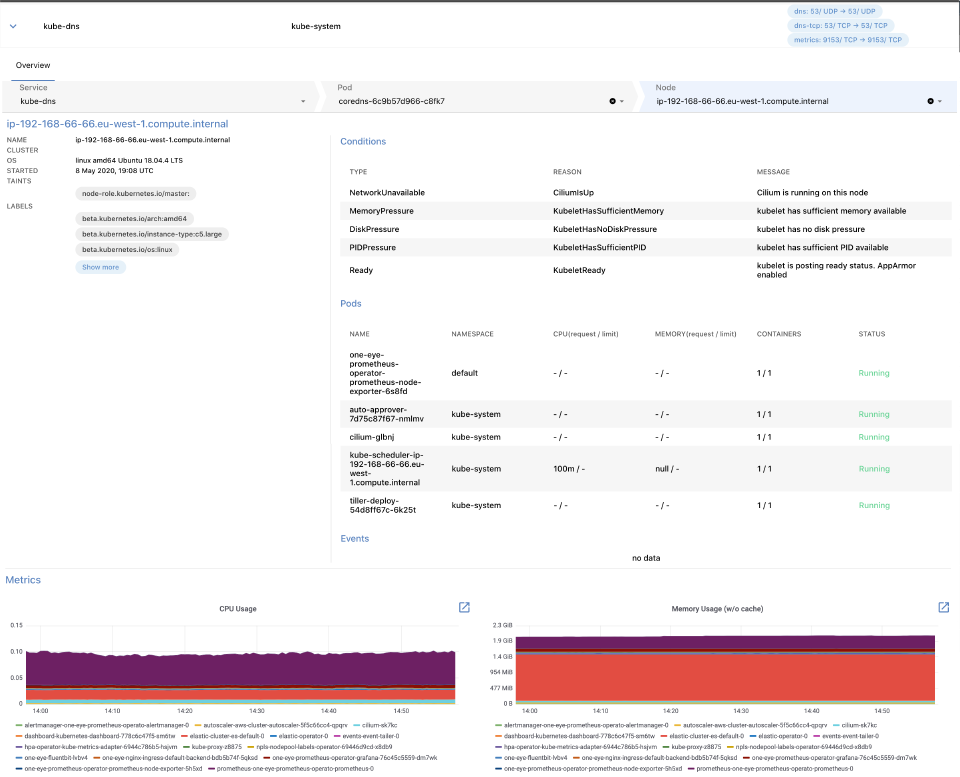
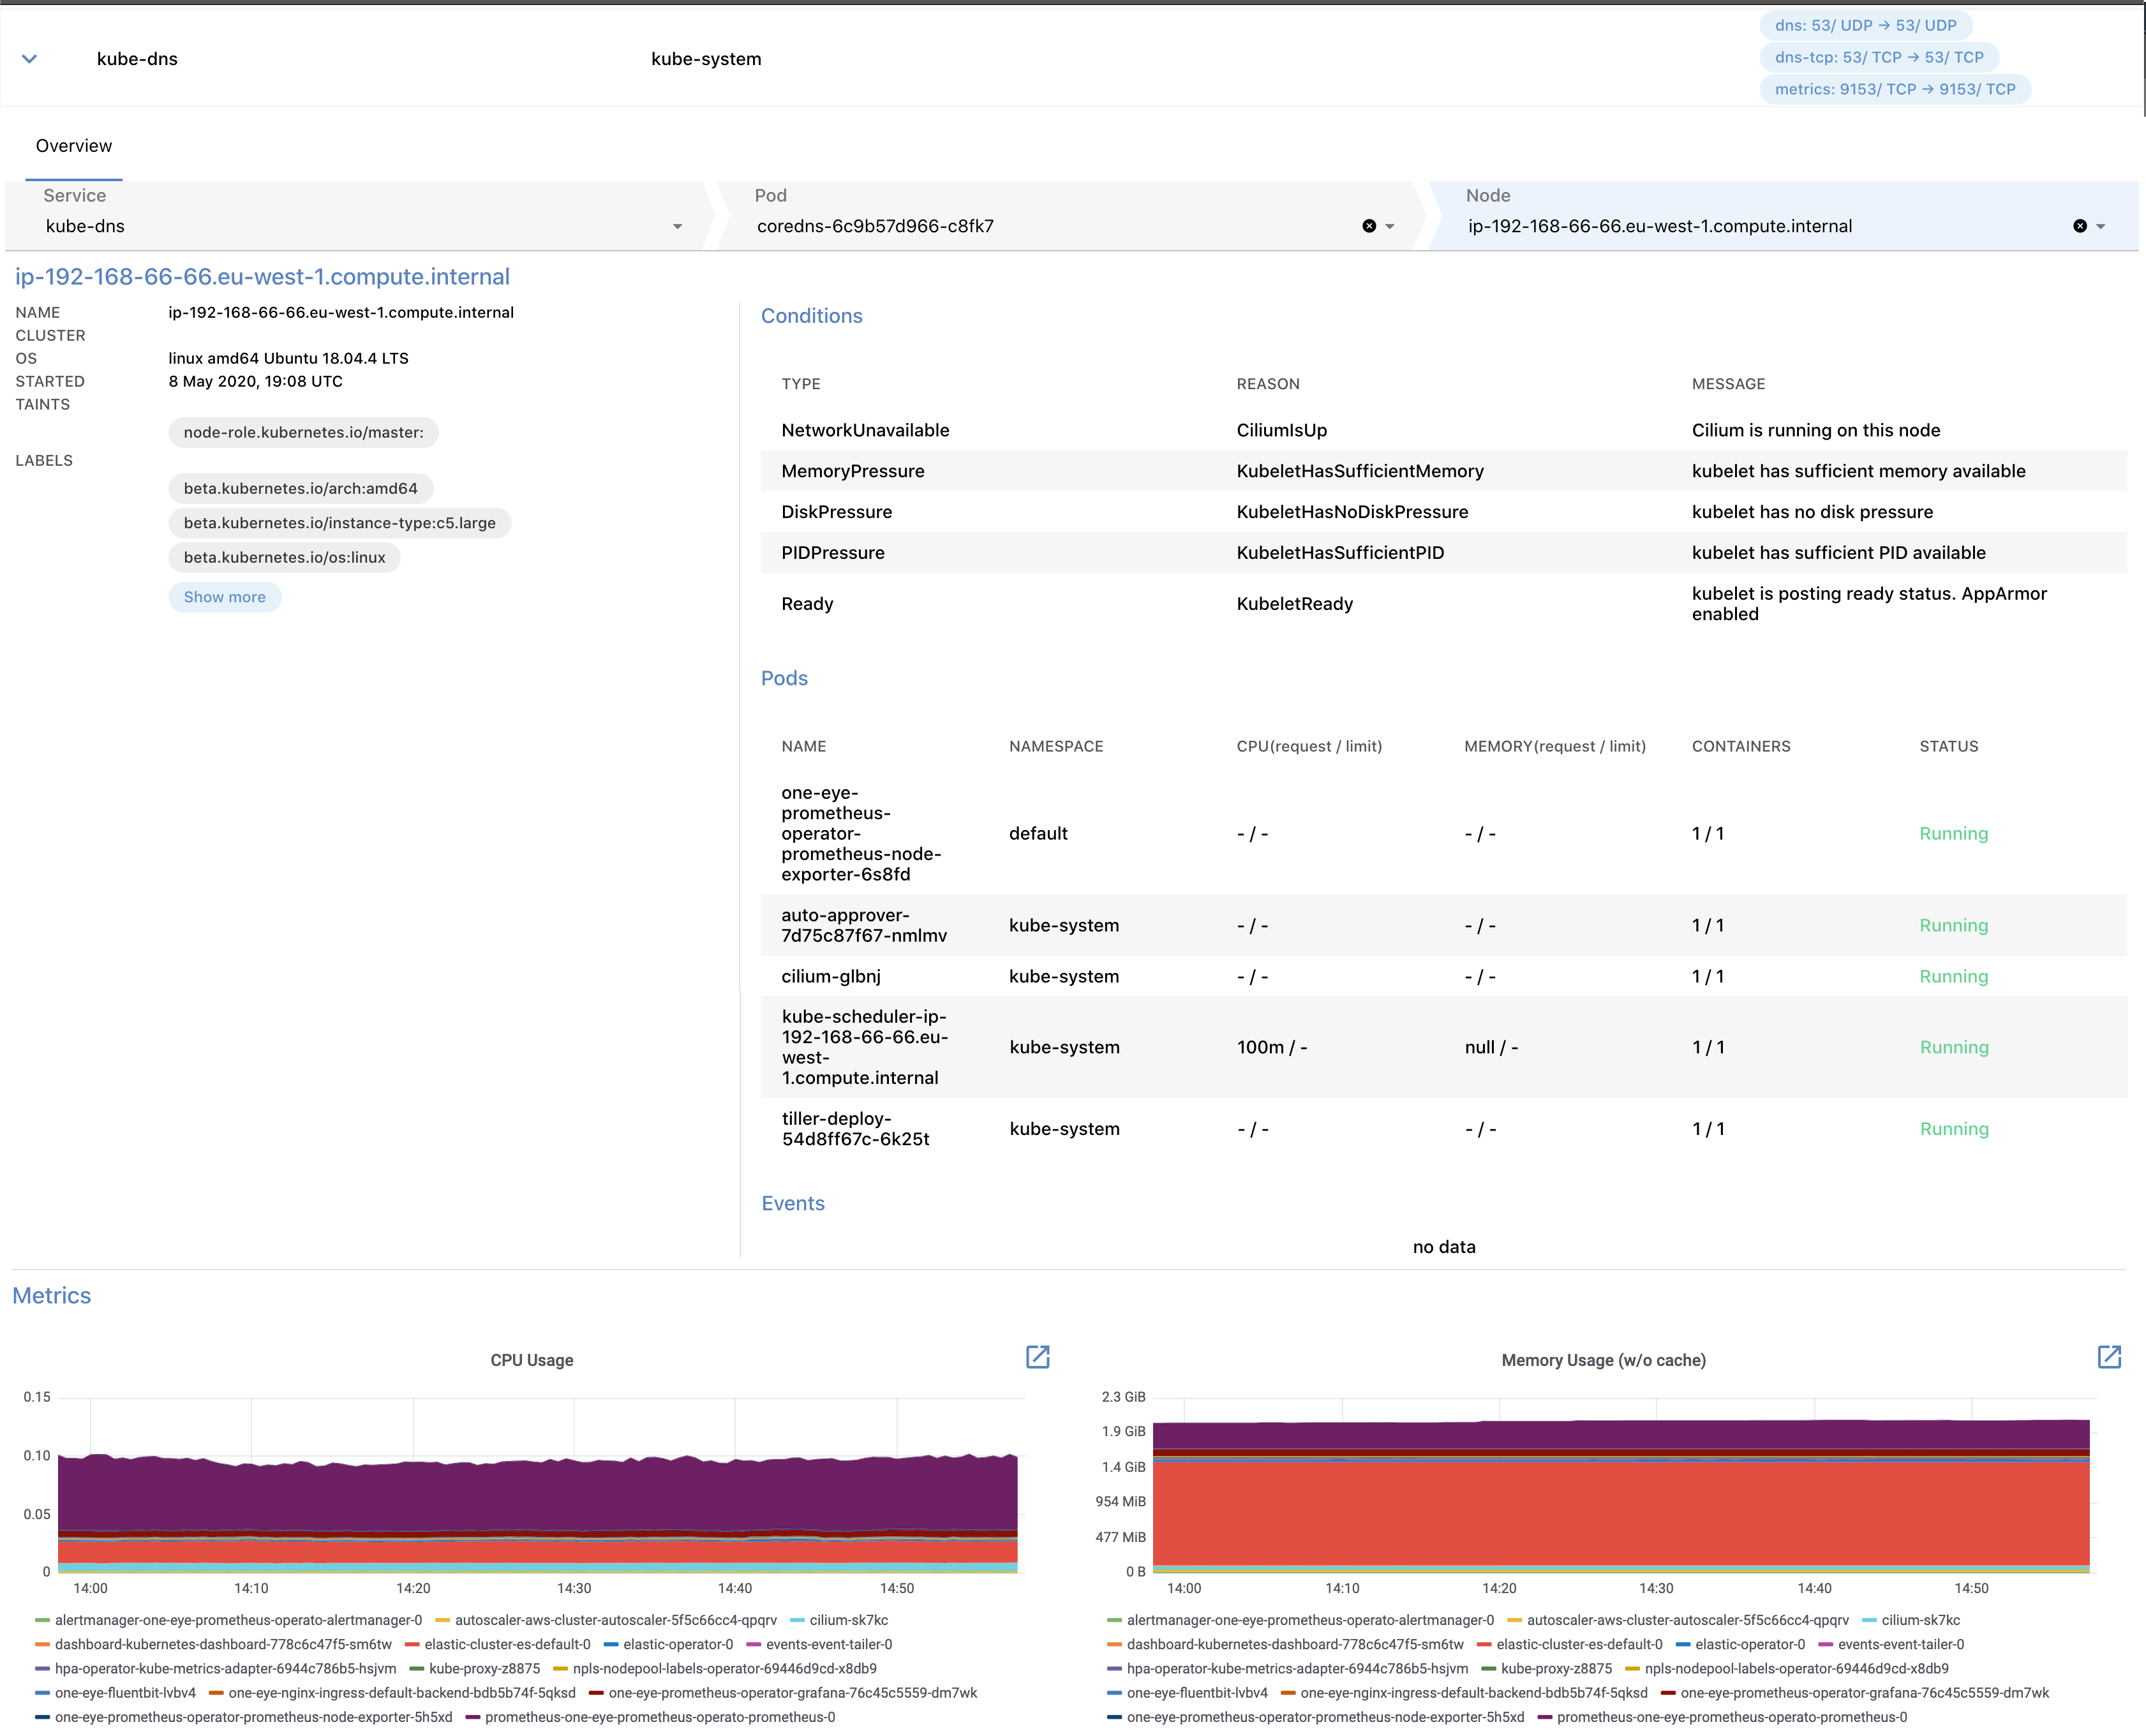
The following details of the node that the pod is running on are displayed:
- CLUSTER: The name of the Kubernetes cluster the node belongs to.
- OS: The operating system running on the node, for example: linux amd64 (Ubuntu 18.04.4 LTS)
- STARTED: The date when the node was started.
- TAINTS: The list of Kubernetes taints assigned to the node.
- LABELS: The list of Kubernetes labels assigned to the node.
- Conditions: The status of the node, for example, disk and memory pressure, or network and kubelet status.
- Pods: The list of pods currently running on the node.
- Events: Recent events related to the node.
- Metrics: Dashboards of the most important metrics. Click to open the related dashboards in Grafana.


