
The MENU > METRICS page allows you to search and display the collected metrics using the Prometheus PromQL query language directly on the One Eye interface.
To search and review the collected metrics, complete the following steps.
- Select MENU > METRICS.
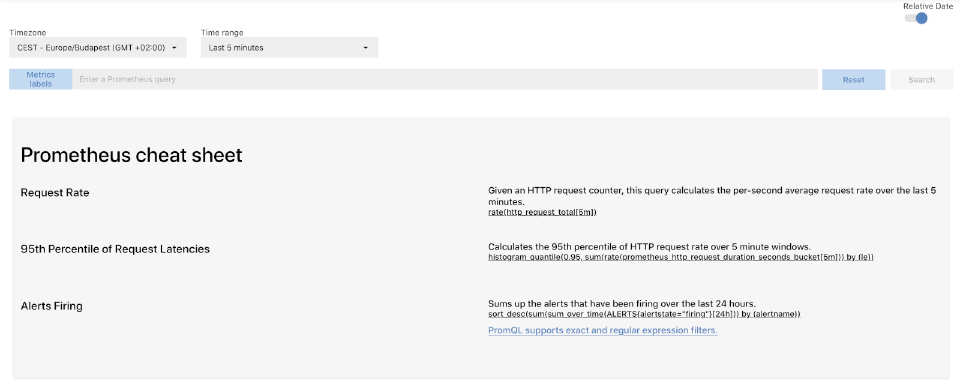
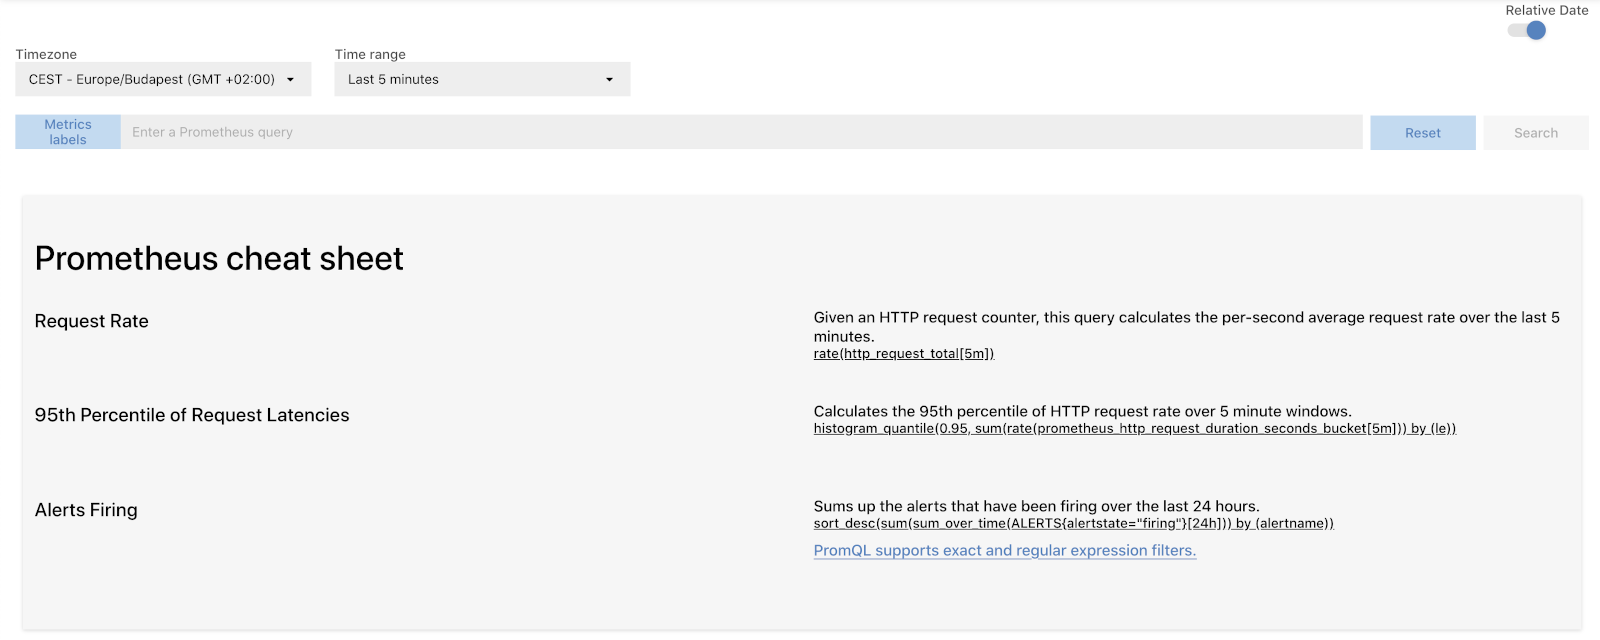
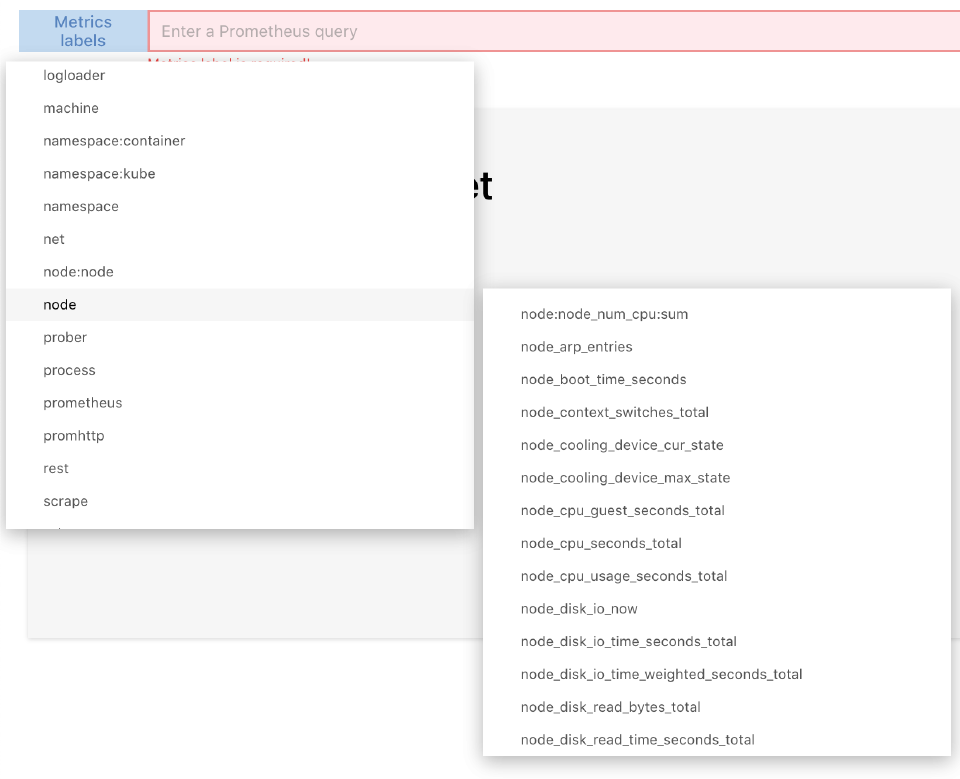
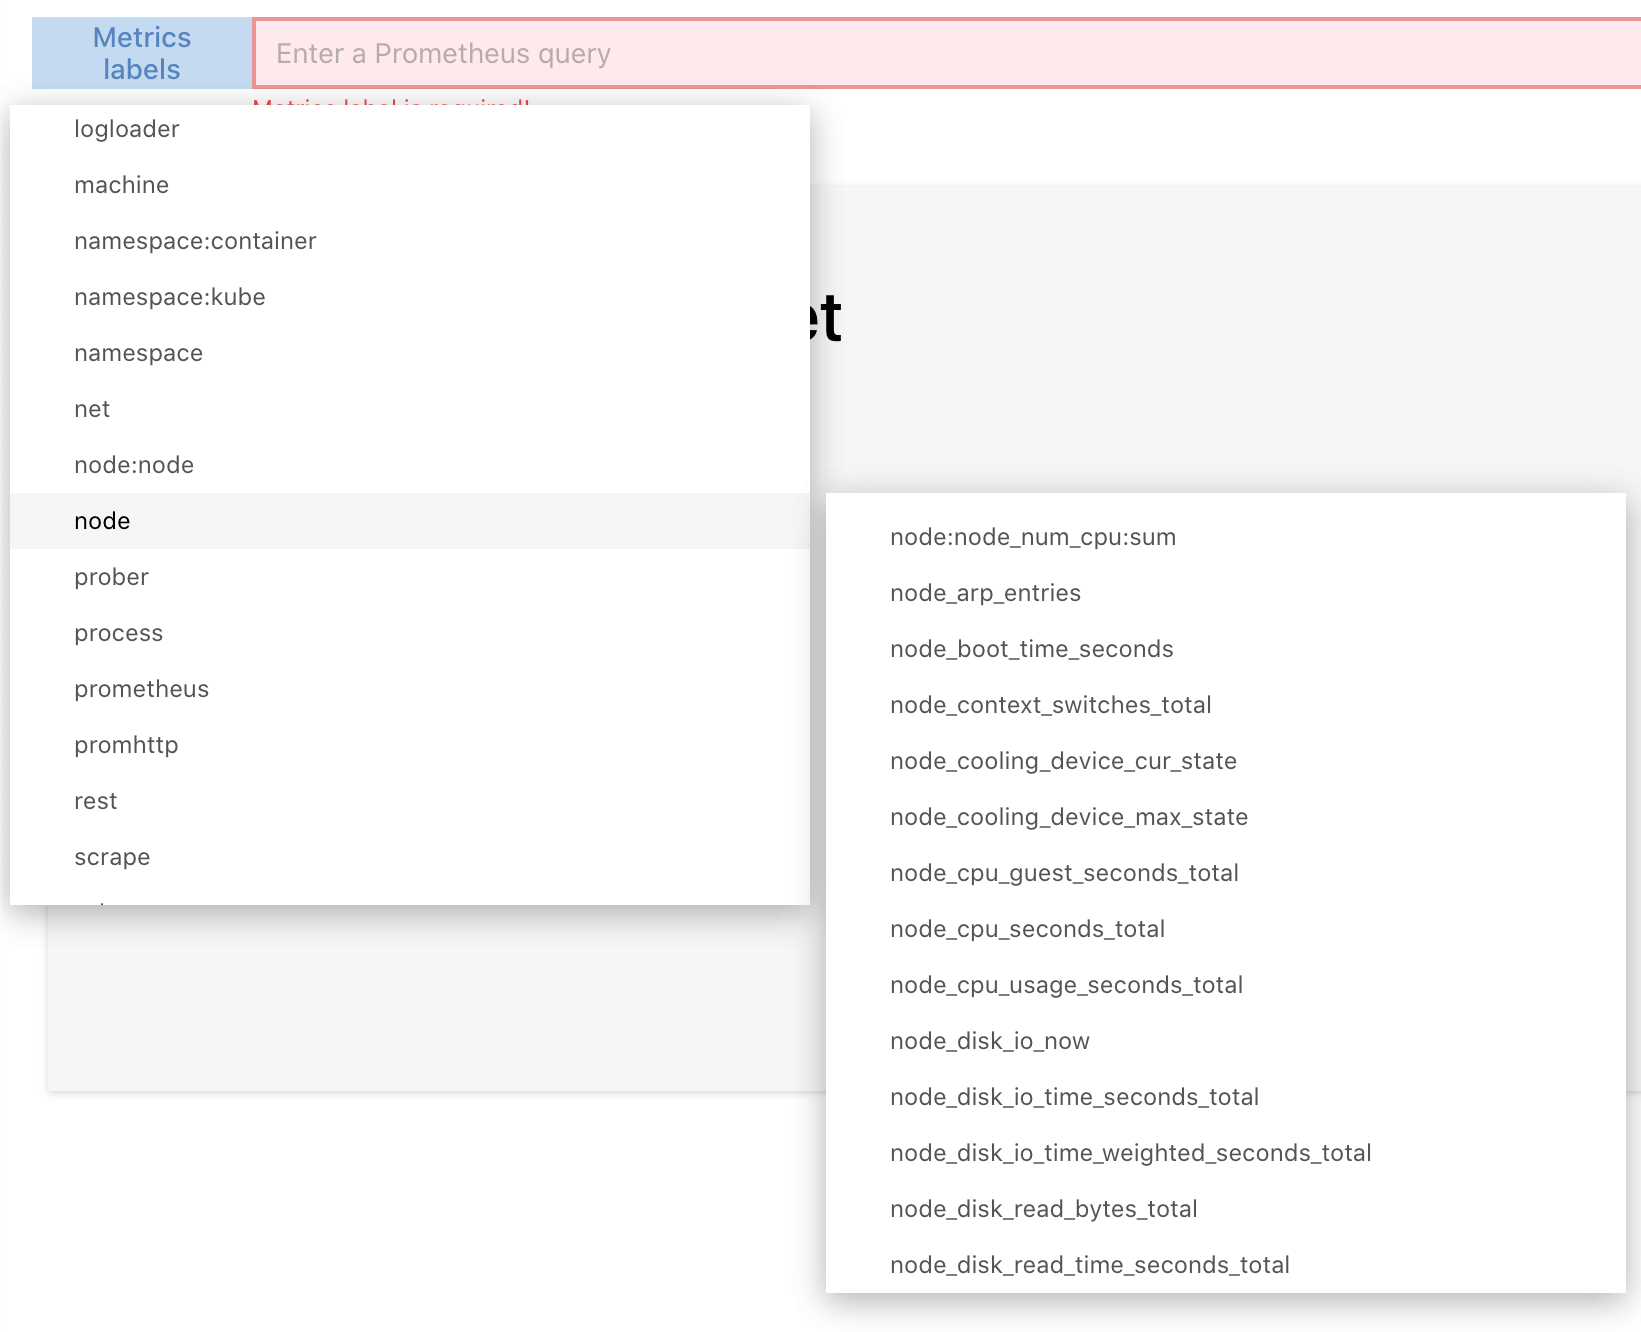
- Click Metrics labels and select a predefined query, or enter a PromQL expression into the query field.
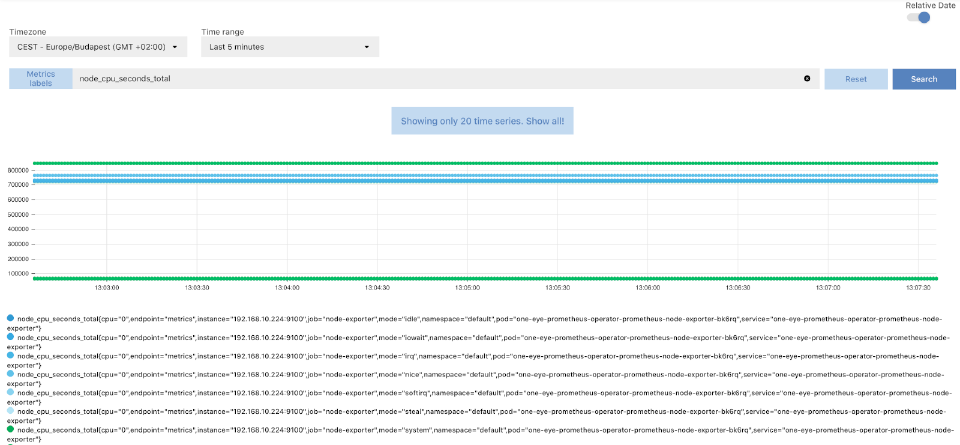
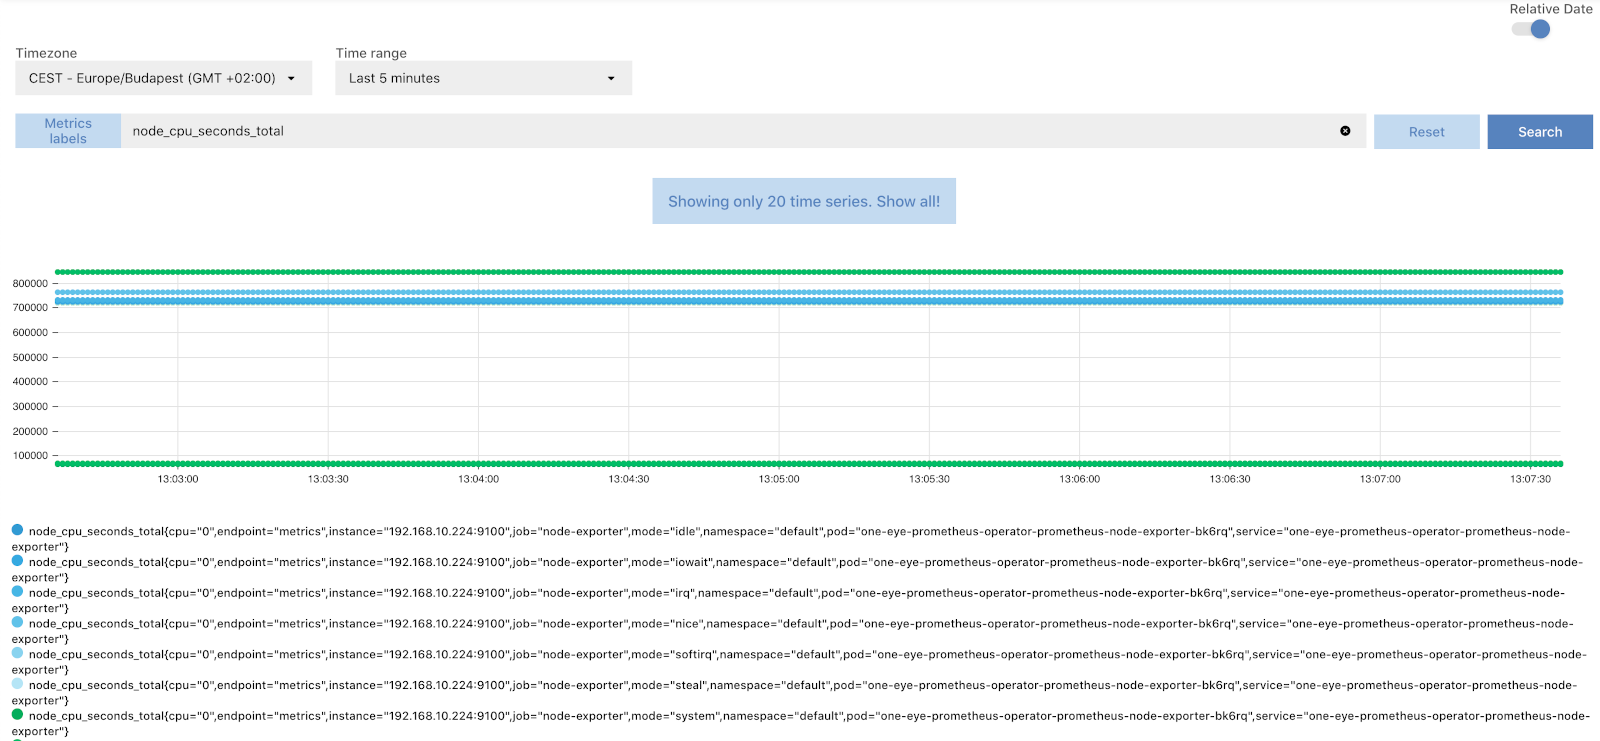
- Click Search. The metrics matching the expression are displayed.
- To display the recent metrics, select the time range from the Time range field.
- To display the metrics of a specific time interval, disable Relative Date, fill the start date and end date fields, then click Search.


