

This guide describes how to collect application and container logs in Kubernetes using the Logging operator, and how to send them to Splunk.
Logging operator collects the logs from the application, selects which logs to forward to the output, and sends the selected log messages to the output (in this case, to Splunk). For more details about the Logging operator, see the Logging operator overview.
Deploy Splunk 🔗︎
First, deploy Splunk Standalone in your Kubernetes cluster. The following procedure is based on the Splunk on Kubernetes quickstart.
-
Create the
loggingNamespace.kubectl create ns logging -
Install the Splunk operator.
kubectl apply -n logging -f https://tiny.cc/splunk-operator-install -
Install the Splunk cluster.
kubectl apply -n logging -f - <<"EOF"
apiVersion: enterprise.splunk.com/v1alpha2
kind: Standalone
metadata:
  name: single
spec:
  config:
    splunkPassword: helloworld456
    splunkStartArgs: --accept-license
  topology:
    standalones: 1
EOF
Deploy the Logging operator and a demo Application 🔗︎
Install the Logging operator and a demo application to provide sample log messages.
Deploy the Logging operator with Helm 🔗︎
To install the Logging operator using Helm, see Deploy the Logging operator with Helm.
-
Create the
loggingresource.kubectl -n logging apply -f - <<"EOF" apiVersion: logging.banzaicloud.io/v1beta1 kind: Logging metadata: name: default-logging-simple spec: fluentd: {} fluentbit: {} controlNamespace: logging EOFNote: You can use the
ClusterOutputandClusterFlowresources only in thecontrolNamespace. -
Get a Splunk HEC Token.
HEC_TOKEN=$(kubectl get secret -n logging splunk-single-standalone-secrets -o jsonpath='{.data.hec_token}' | base64 --decode) -
Create a Splunk output secret from the token.
kubectl create secret generic splunk-token -n logging --from-literal "SplunkHecToken=${HEC_TOKEN}" -
Define a Splunk
output.kubectl -n logging apply -f - <<"EOF" apiVersion: logging.banzaicloud.io/v1beta1 kind: Output metadata: name: splunk-output spec: splunkHec: hec_host: splunk-single-standalone-headless insecure_ssl: true hec_port: 8088 hec_token: valueFrom: secretKeyRef: name: splunk-token key: SplunkHecToken index: main format: type: json EOF -
Create a
flowresource.kubectl -n logging apply -f - <<"EOF" apiVersion: logging.banzaicloud.io/v1beta1 kind: Flow metadata: name: splunk-flow spec: filters: - tag_normaliser: {} - parser: remove_key_name_field: true reserve_data: true parse: type: nginx match: - select: labels: app.kubernetes.io/name: log-generator localOutputRefs: - splunk-output EOF -
Install the demo application.
kubectl -n logging apply -f - <<"EOF"
apiVersion: apps/v1
kind: Deployment
metadata:
 name: log-generator
 labels:
   app.kubernetes.io/name: log-generator
spec:
 replicas: 3
 selector:
   matchLabels:
     app.kubernetes.io/name: log-generator
 template:
   metadata:
     labels:
       app.kubernetes.io/name: log-generator
   spec:
     containers:
     - name: log-generator
       image: banzaicloud/log-generator:0.3.2
EOF
Validate the deployment 🔗︎
To validate that the deployment was successful, complete the following steps.
-
Use the following command to retrieve the password of the
adminuser:kubectl -n logging get secret splunk-single-standalone-secrets -o jsonpath='{.data.password}' | base64 --decode -
Enable port forwarding to the Splunk Dashboard Service.
kubectl -n logging port-forward svc/splunk-single-standalone-headless 8000 -
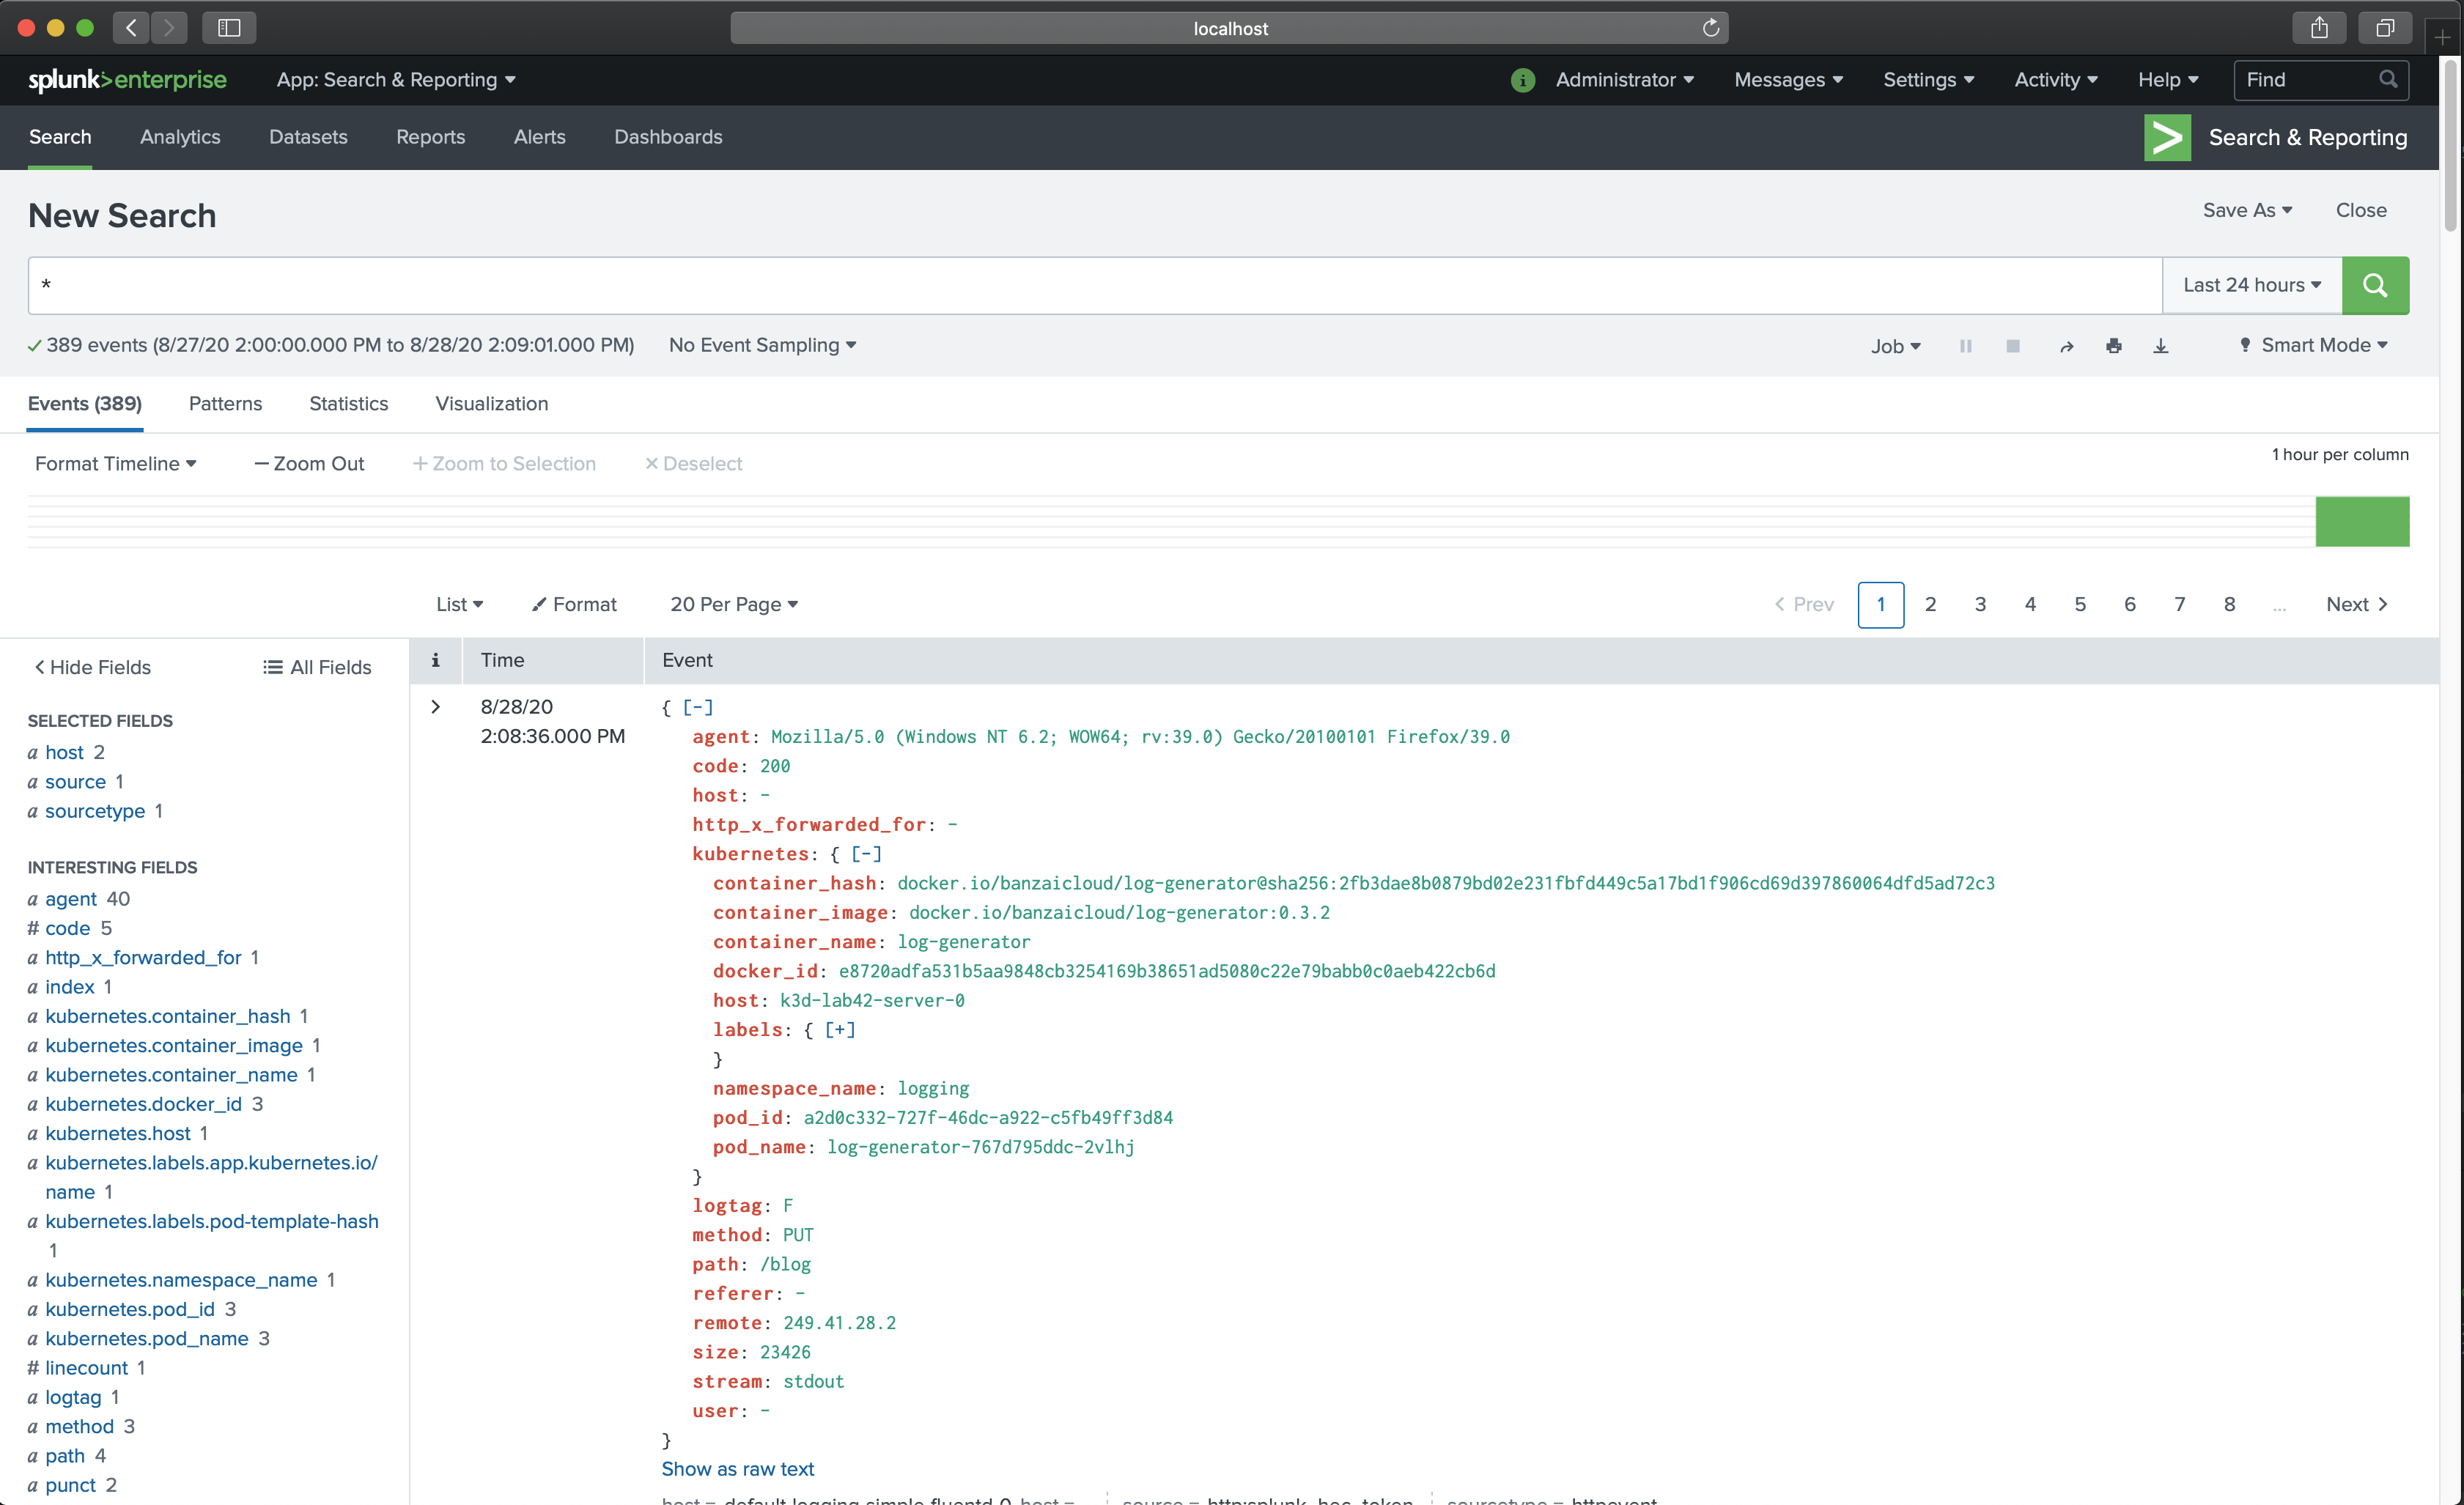
Open the Splunk dashboard in your browser: http://localhost:8000. You should see the dashboard and some sample log messages from the demo application.
If you don’t get the expected result you can find help in the troubleshooting section.


