
Using the One Eye web UI, you can drill-down from the alert, service, or workload level, and trace back an issue by navigating deeper in the stack, and see the status and most important metrics of your Kubernetes controllers, pods, and nodes.
List of workloads 🔗︎
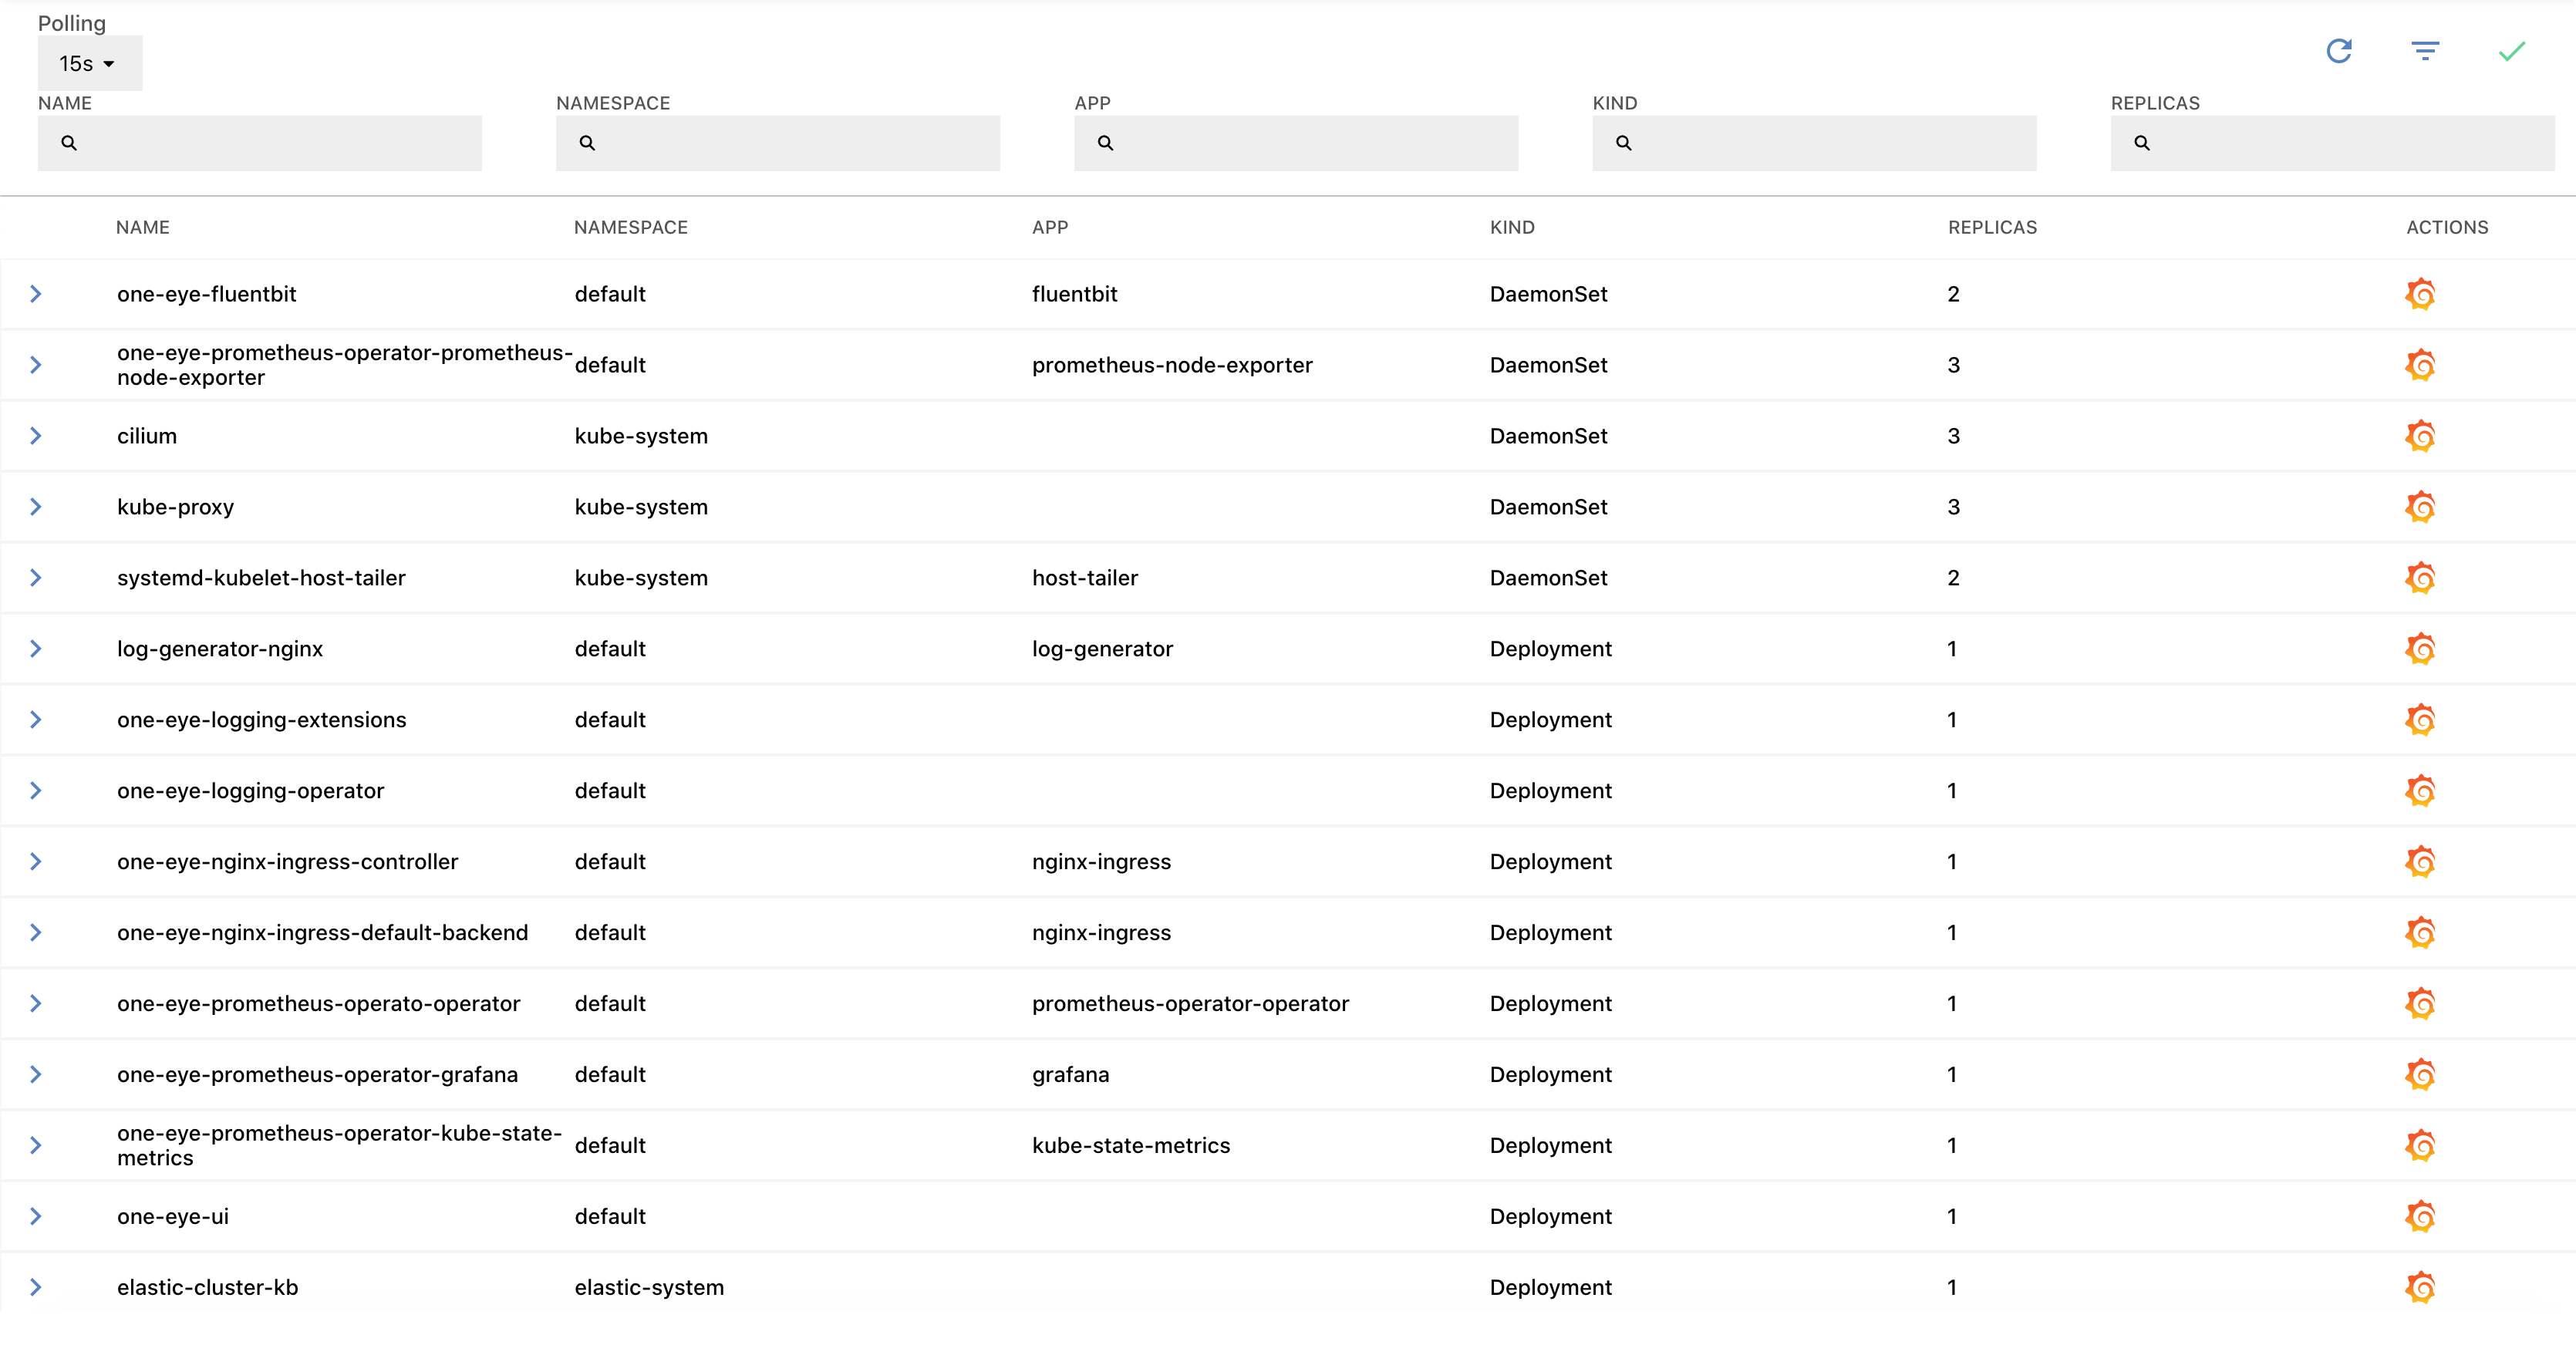
The MENU > WORKLOADS page contains information about the workloads your logging infrastructure collects data from. The list displays the following information about the workloads:
- NAME: The name of the workload.
- NAMESPACE: The namespace the workload belongs to.
- APP: The application running in the workload.
- KIND: The kind of the workload, for example, DaemonSet, Deployment, ReplicaSet, or StatefulSet.
- REPLICAS: The number of replicas for the workload.
To quickly find a workload, or to filter the list to show only workloads that match a criteria, click
to display the filter bar.
Click on the name of a workload to display its details.
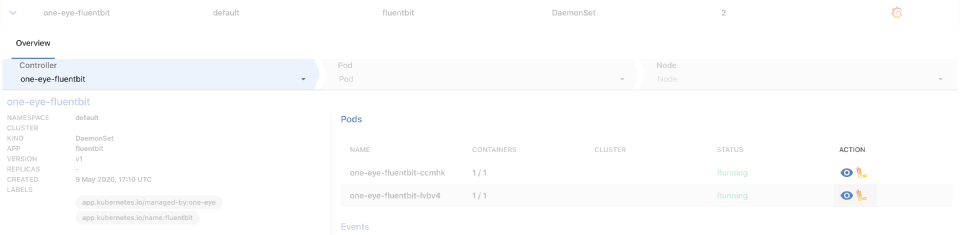
From the details overview, you can drill down through the following levels to the underlying resources of the infrastructure: Overview > Controller > Pod > Node

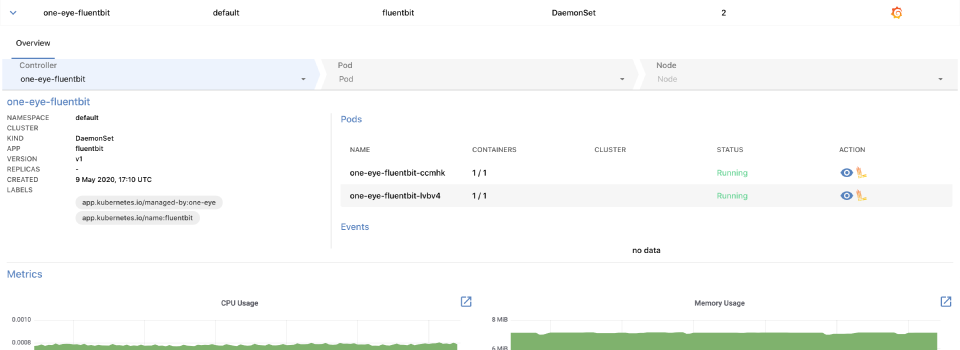
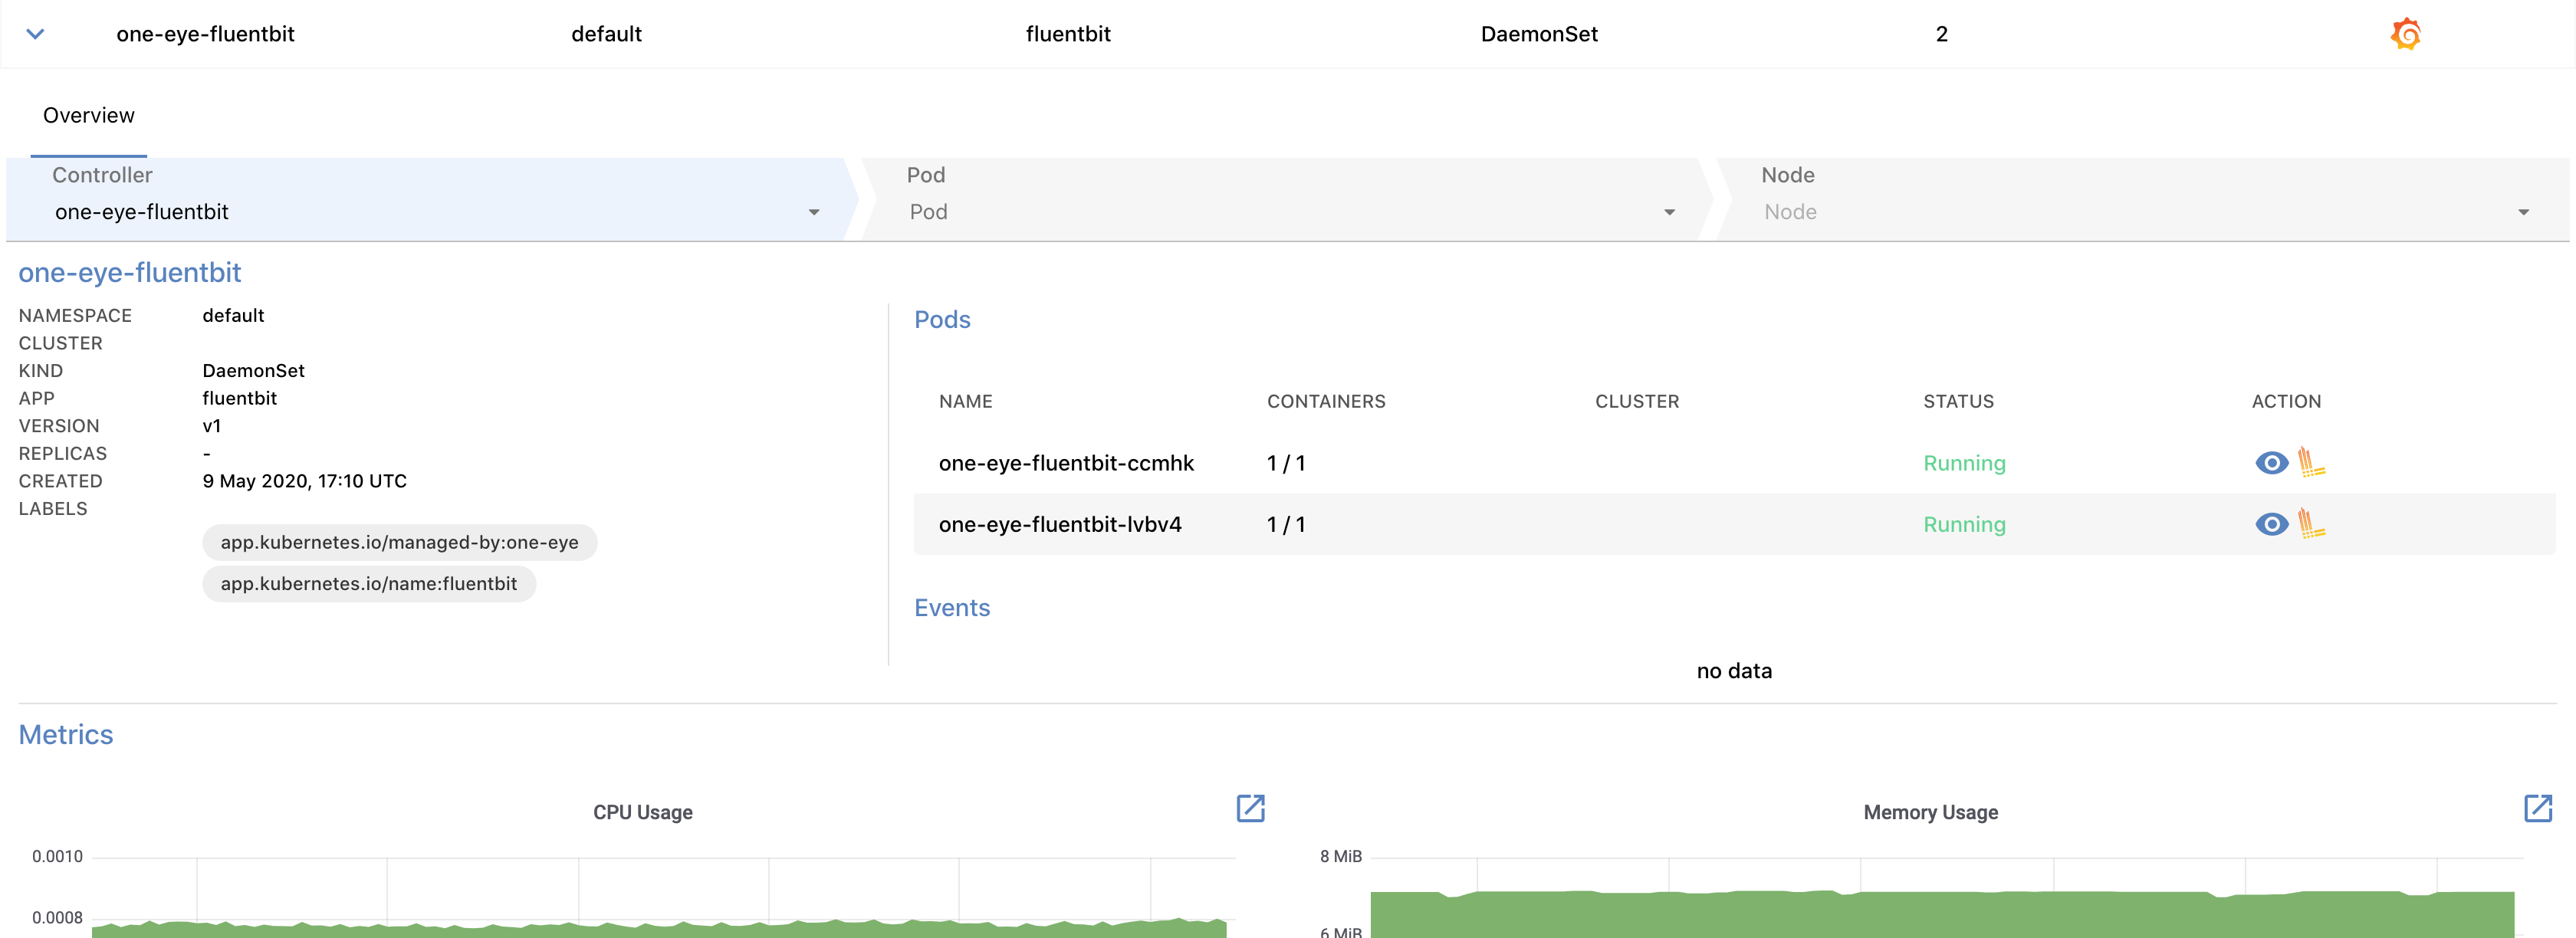
Workload details 🔗︎
Select a Workload from the list to display its details.
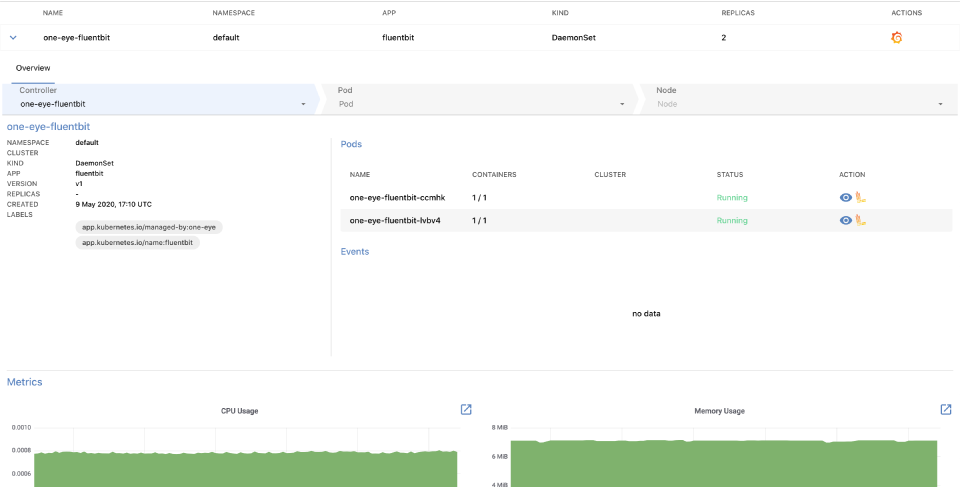

The following details of the workload are displayed:
- Controller: The controllers related to the workload. Click on a controller to display its details.
- NAMESPACE: The namespace the workload belongs to.
- CLUSTER: The name of the Kubernetes cluster the workload belongs to.
- KIND: The kind of the workload, for example, DaemonSet, Deployment, ReplicaSet, or StatefulSet.
- APP: The application running in the workload.
- VERSION: The version number of the workload, for example, v2.
- REPLICAS: The number of replicas for the workload.
- LABELS: The list of Kubernetes labels assigned to the resource.
- Pods: The list of pods running this workload. Click on the name of the pod to display the details of the pod. You can also display, search, and tail the logs of the pod.
- Events: Recent events related to the resource.
- Metrics: Dashboards of the most important metrics. Click
 to open the related dashboards in Grafana.
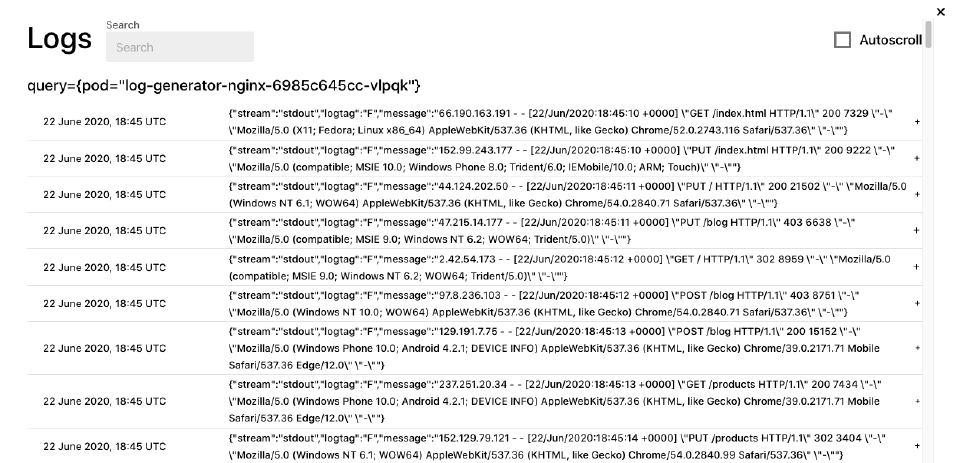
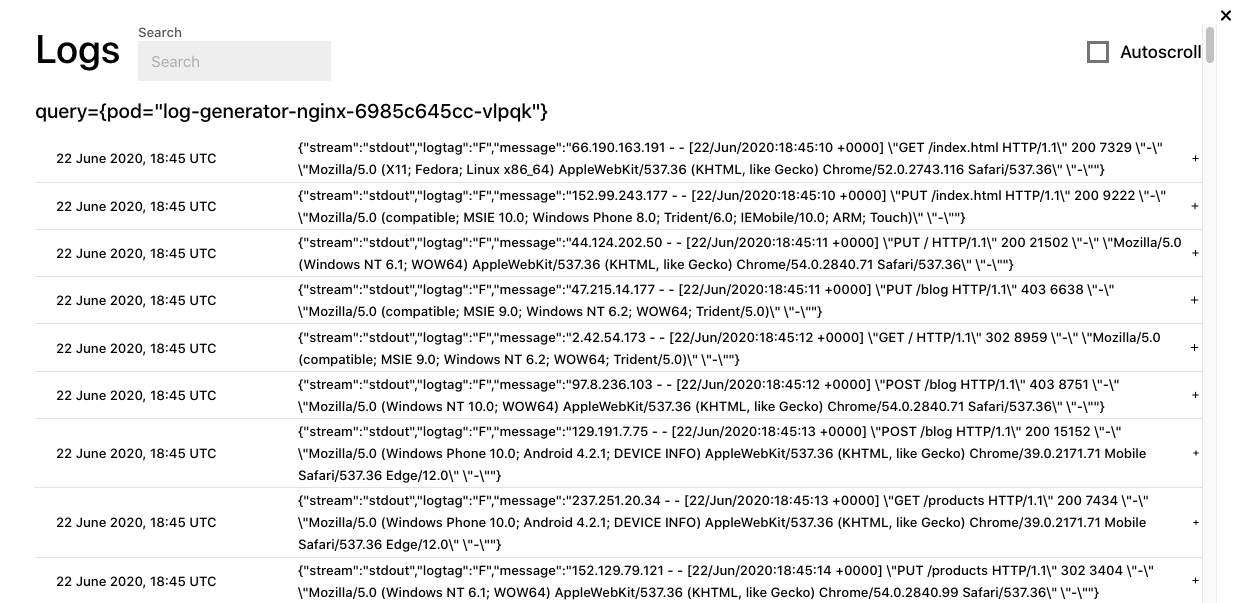
Pod logs 🔗︎
To display the logs of a pod, click ![]() icon in the ACTION column of the pod.
icon in the ACTION column of the pod.

You can search in the logs of the pod, or tail them by selecting Autoscroll.
Pod details 🔗︎
To check the details of a pod, click the name of a pod in the Pods section.
The following details of the pod are displayed:
- NAMESPACE: The namespace the pod belongs to.
- CLUSTER: The name of the Kubernetes cluster the pod belongs to.
- NODE: The hostname of the node the pod is running on, for example, ip-192-168-1-1.us-east-2.compute.internal. Click on the name of the node to display the details of the node.
- IP: The IP address of the pod.
- STARTED: The date when the pod was started.
- LABELS: The list of Kubernetes labels assigned to the resource.
- Containers: The list of containers in the pod. Also includes the Name, Image, and Status of the container.
- Events: Recent events related to the resource.
- Metrics: Dashboards of the most important metrics. Click to open the related dashboards in Grafana.
Node details 🔗︎
To check the details of a node, select a node in the pod details view. The node view is the deepest layer of the drill-down view and shows information about a Kubernetes node.
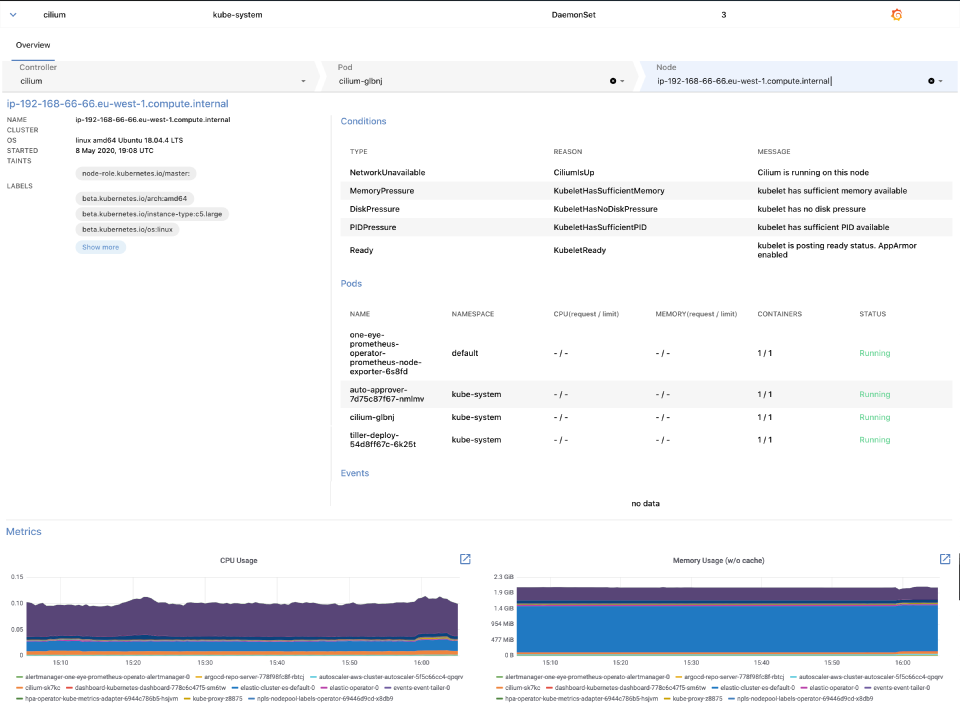
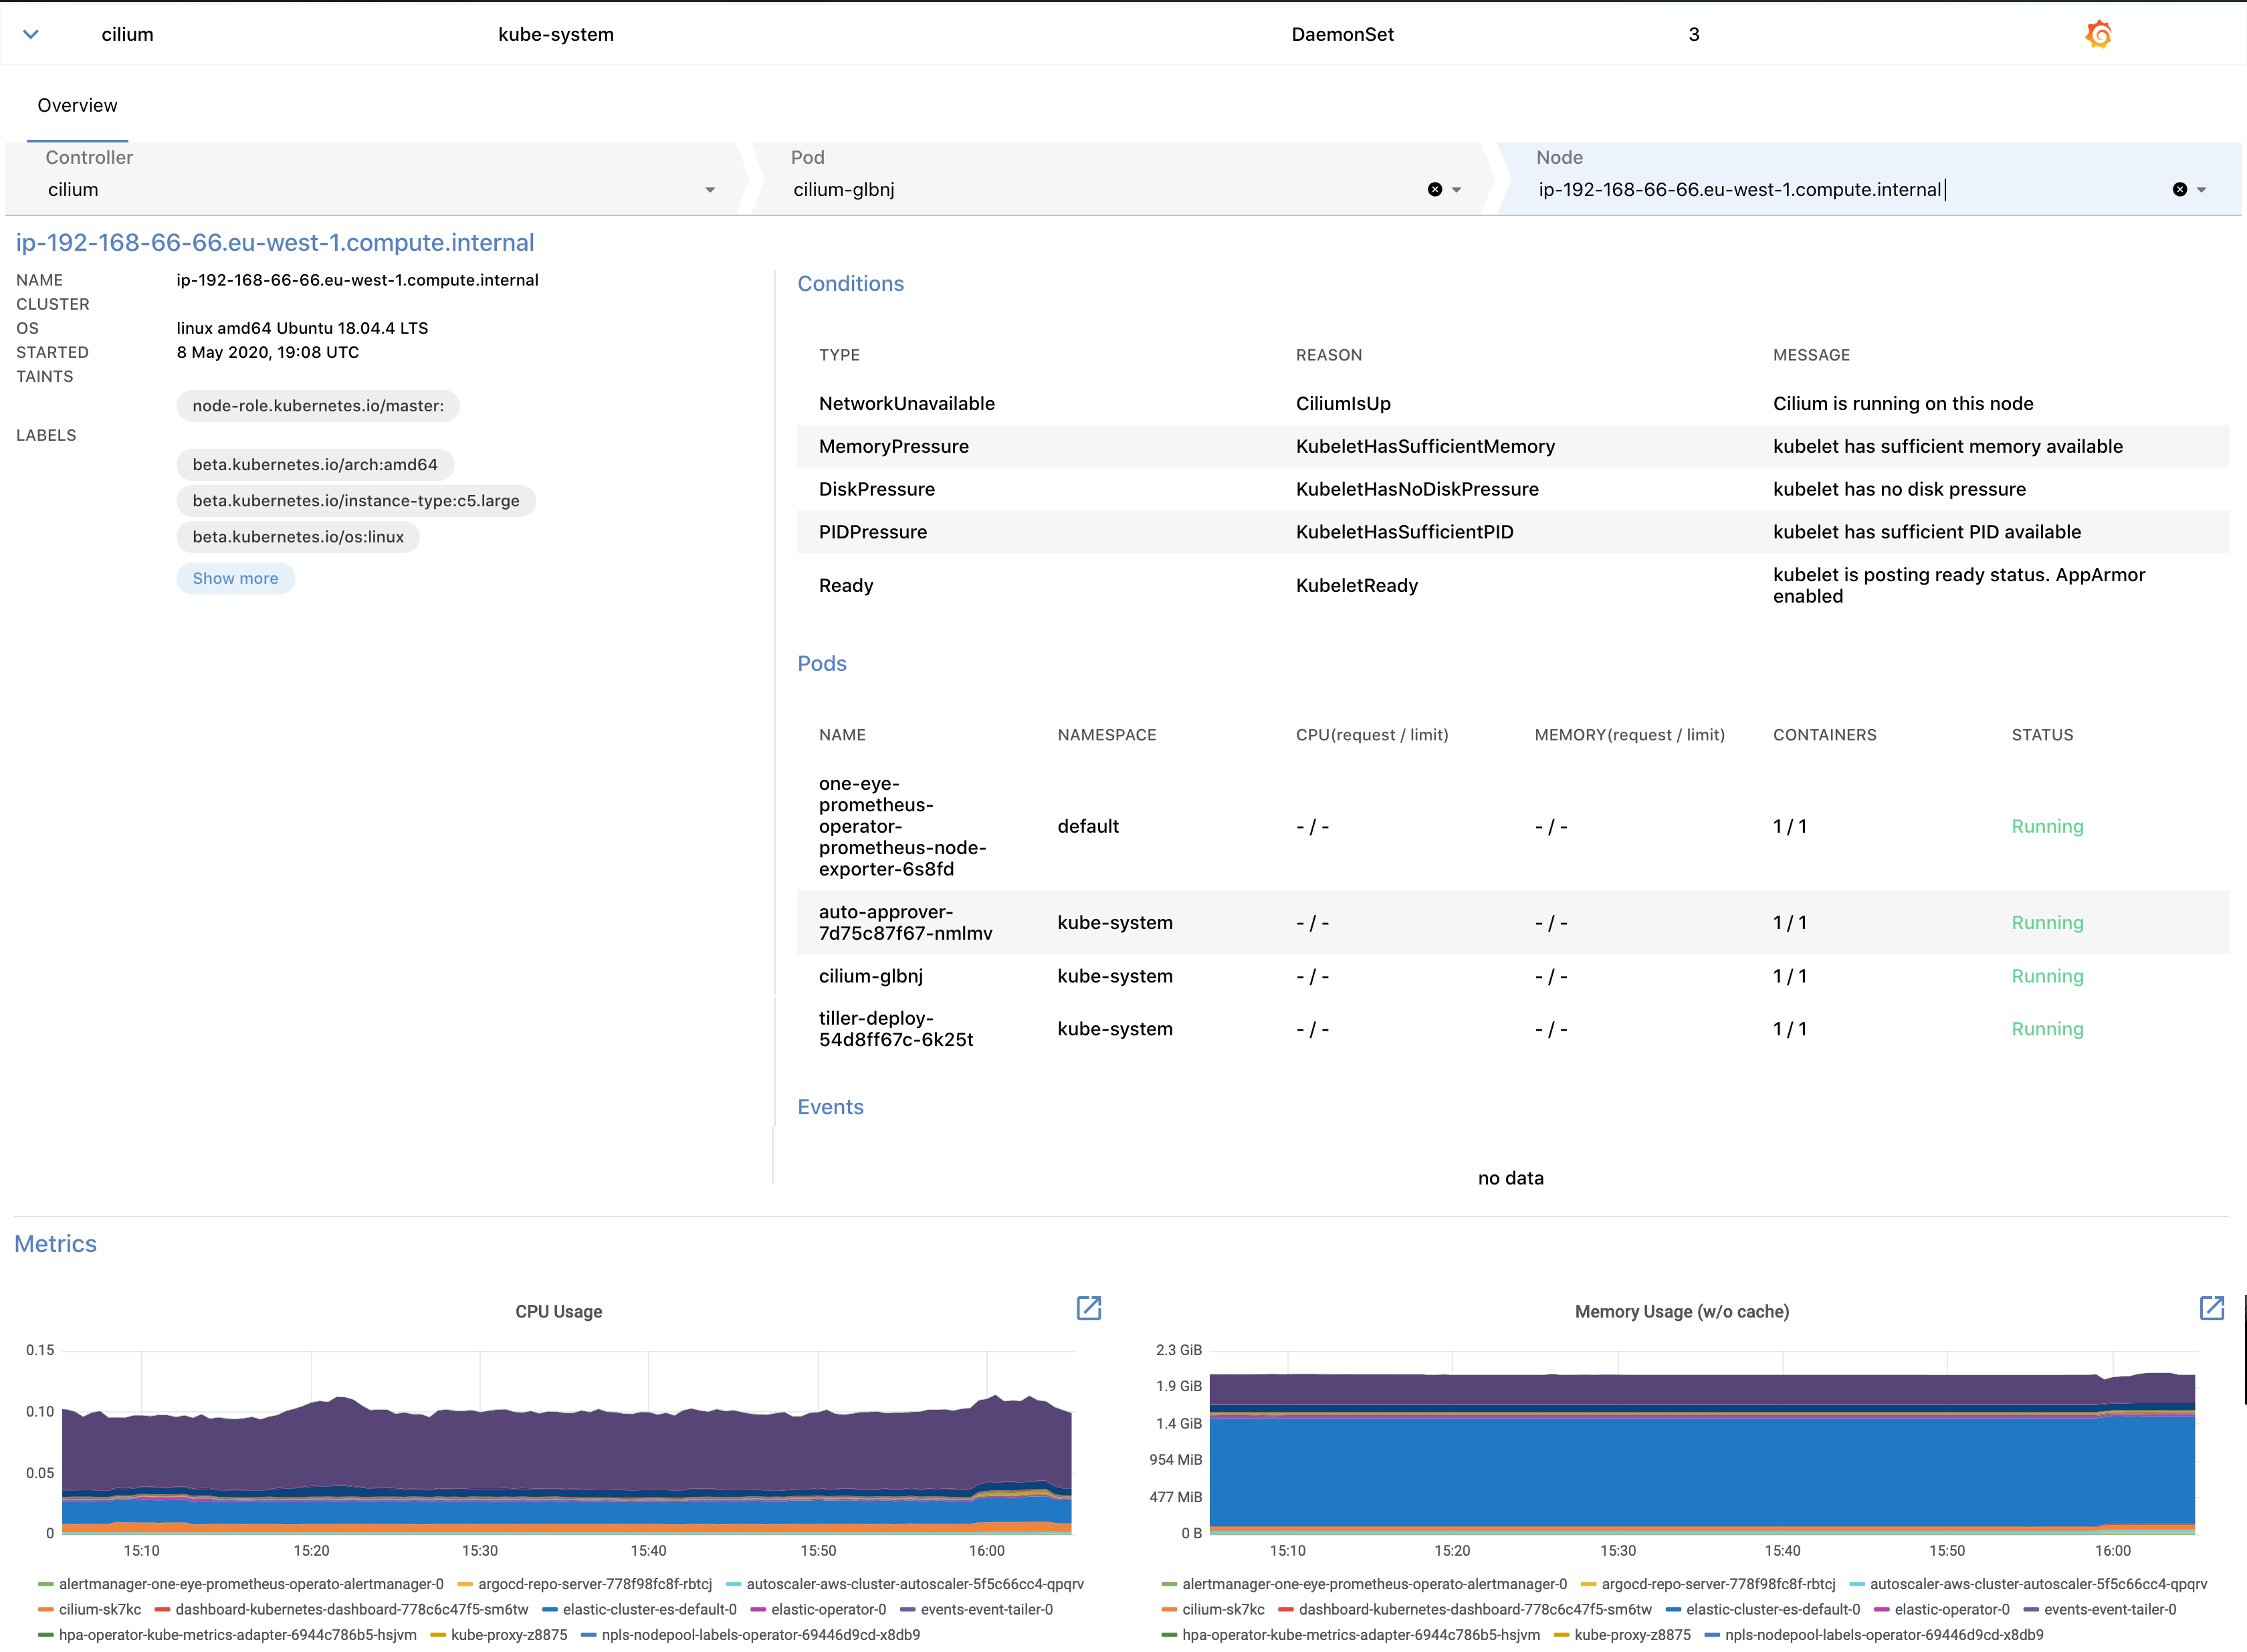
The following details of the node that the pod is running on are displayed:
- CLUSTER: The name of the Kubernetes cluster the node belongs to.
- OS: The operating system running on the node, for example: linux amd64 (Ubuntu 18.04.4 LTS)
- STARTED: The date when the node was started.
- TAINTS: The list of Kubernetes taints assigned to the node.
- LABELS: The list of Kubernetes labels assigned to the node.
- Conditions: The status of the node, for example, disk and memory pressure, or network and kubelet status.
- Pods: The list of pods currently running on the node.
- Events: Recent events related to the node.
- Metrics: Dashboards of the most important metrics. Click to open the related dashboards in Grafana.


