This section describes how to set alerts for your logging infrastructure. Alternatively, you can enable the default alerting rules that are provided by the Logging operator.
Note: Alerting based on the contents of the collected log messages is not covered here.
Prerequisites 🔗︎
Using alerting rules requires the following:
- Logging operator 3.14.0 or newer installed on the cluster.
- Prometheus operator installed on the cluster. For details, see Monitor your logging pipeline with Prometheus Operator.
-
syslog-ng is supported only in Logging operator 4.0 or newer.
Enable the default alerting rules 🔗︎
Logging operator comes with a number of default alerting rules that help you monitor your logging environment and ensure that it’s working properly. To enable the default rules, complete the following steps.
-
Verify that your cluster meets the Prerequisites.
-
Enable the alerting rules in your logging CR. You can enable alerting separately for Fluentd, syslog-ng, and Fluent Bit. For example:
apiVersion: logging.banzaicloud.io/v1beta1 kind: Logging metadata: name: default-logging-simple namespace: logging spec: fluentd: metrics: prometheusRules: true fluentbit: metrics: prometheusRules: true syslogNG: metrics: prometheusRules: true controlNamespace: logging -
If needed you can add custom alerting rules.
Overview of default alerting rules 🔗︎
The default alerting rules trigger alerts when:
For the Fluent Bit log collector:
- The number of Fluent Bit errors or retries is high
For the Fluentd and syslog-ng log forwarders:
- Prometheus cannot access the log forwarder node
- The buffers of the log forwarder are filling up quickly
- Traffic to the log forwarder is increasing at a high rate
- The number of errors or retries is high on the log forwarder
- The buffers are over 90% full
Currently, you cannot modify the default alerting rules, because they are generated from the source files. For the detailed list of alerts, see the source code:
- For Fluentd
- For syslog-ng
- For Fluent Bit
To enable these alerts on your cluster, see Enable the default alerting rules.
Add custom alerting rules 🔗︎
Although you cannot modify the default alerting rules, you can add your own custom rules to the cluster by creating and applying AlertmanagerConfig resources to the Prometheus Operator.
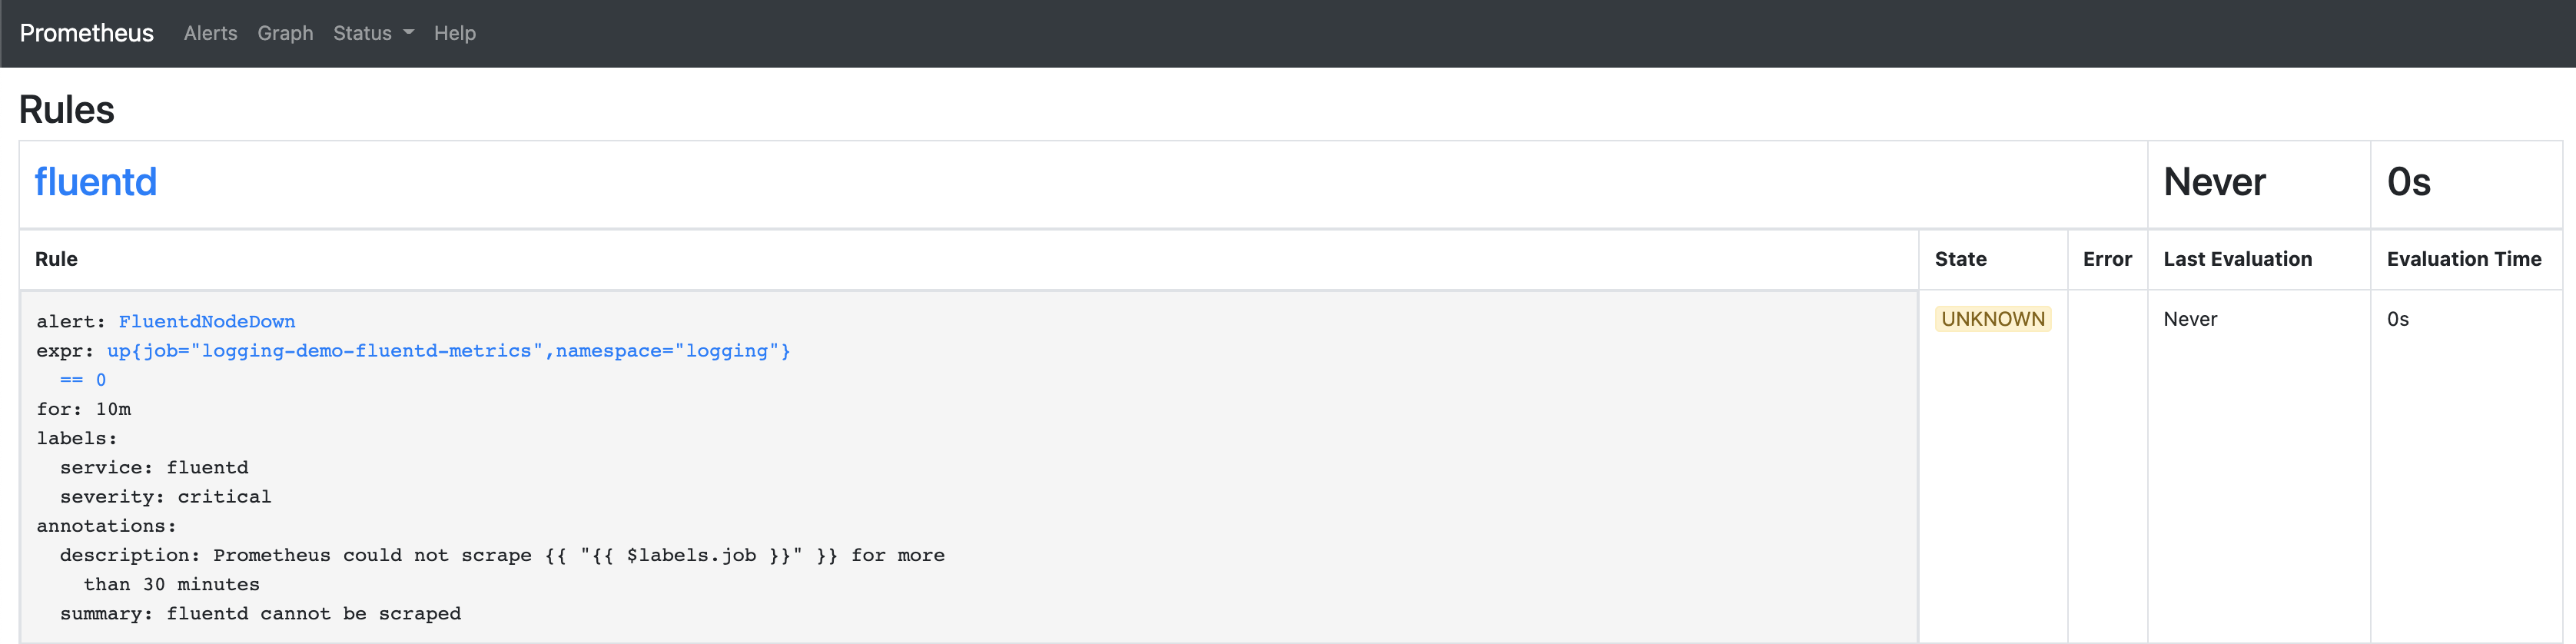
For example, the Logging operator creates the following alerting rule to detect if a Fluentd node is down:
apiVersion: monitoring.coreos.com/v1
kind: PrometheusRule
  name: logging-demo-fluentd-metrics
  namespace: logging
spec:
  groups:
  - name: fluentd
    rules:
    - alert: FluentdNodeDown
      annotations:
        description: Prometheus could not scrape {{ "{{ $labels.job }}" }} for more
          than 30 minutes
        summary: fluentd cannot be scraped
      expr: up{job="logging-demo-fluentd-metrics", namespace="logging"} == 0
      for: 10m
      labels:
        service: fluentd
        severity: critical
On the Prometheus web interface, this rule looks like: