Check Fluentd logs 🔗︎
One Eye doesn’t send Fluentd logs to the standard output, because a bad configuration can cause a self-perpetuating process, generating logs exponentially. To avoid this, Fluentd logs are stored inside the container under the /fluentd/log/out path.
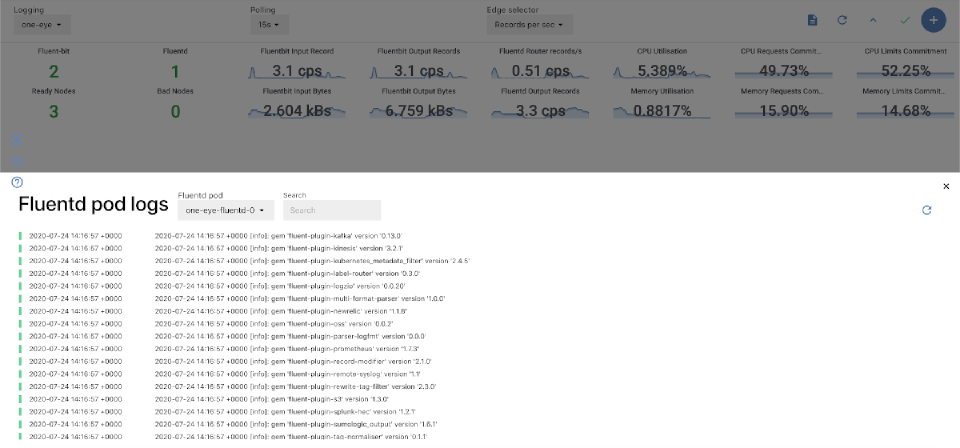
To debug the Logging operator, always check the Fluentd logs first. In One Eye, you can access and search these logs from the web UI:
-
Navigate to
 > LOGGING OVERVIEW >
  . A panel opens showing the Fluentd pod logs.
 -
If you are running multiple replicas, select which Fluentd pod you want to query.
-
Browse the logs, or use the Search field.
Explain Observer configuration 🔗︎
To display the documentation of the Observer custom resource, you can use the one-eye explain command, which is similar to kubectl explain. For example:
$ one-eye observer explain spec
KIND:     Observer
VERSION:  one-eye.banzaicloud.io/v1alpha1

RESOURCE: spec <Object>

DESCRIPTION:
     ObserverSpec defines the desired state of Observer

FIELDS:
   certmanager <Object>
     CertManager component descriptor

   clusterName <string>
     Custom name for cluster
...


